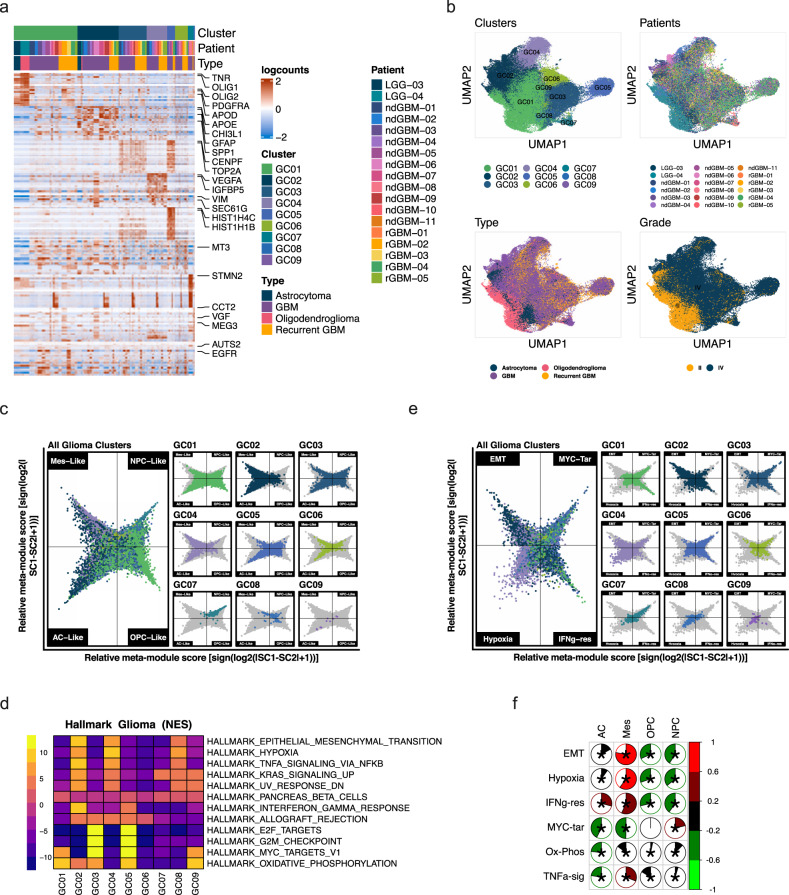
Fig. 2. Molecular characteristics of glioma cells.
Glioma cells in clusters 2, 6, and 9 from Fig. 1b were extracted and analyzed through de novo clustering. a A heatmap showing the top 20 differentially expressed genes in the glioma nine clusters, ranked by FDR. Gene expression values were centered, scaled, and transformed to a scale from −2 to 2. b UMAP projections of glioma cells only, color-coded by cluster number, patient ID, tumor type, and grade. c Two-dimensional butterfly plot visualization of molecular subtype signature scores per Neftel et al. Each quadrant corresponds to one subtype (mesenchymal-like (Mes-like), neural-progenitor-like (NPC-like), astrocyte-like (AC-like) and oligodendrocyte-progenitor-like (OPC-like)), and the position of each cell reflects its relative signature scores. Colors represent different clusters. d A heatmap representation of GSEA Hallmark Pathway gene sets showing the highest and lowest two enriched pathways in each cluster, ranked by normalized enrichment scores (NES). Adjusted p-value cutoff=0.05. Genes were pre-ranked using the Wilcoxon rank-sum test and auROC. Color bar represents NES. e Two-dimensional butterfly plot visualization of the top Hallmark Pathways (EPITHELIAL_MESENCHYMAL_TRANSITION, MYC_TARGETS_V1, HYPOXIA, and INTERFERON_GAMMA_RESPONSE) in different clusters, representing signature scores as relative meta-module scores. Each quadrant corresponds to one Hallmark pathway; the exact position of each cell reflects its relative signature scores in all four pathways. Colors represent different clusters shown in (a). Details on signature score calculation and plot generation are in the Supplementary Methods. f Correlogram showing Pearson correlation coefficients (r) between the top differentially enriched pathways (from d) and glioma molecular subtypes (Neftel et al.). Asterisks represent statistically significant comparisons (p-value < 0.05). Scale bars represent Pearson correlation (r) (red = positive correlation, green = negative correlation).

