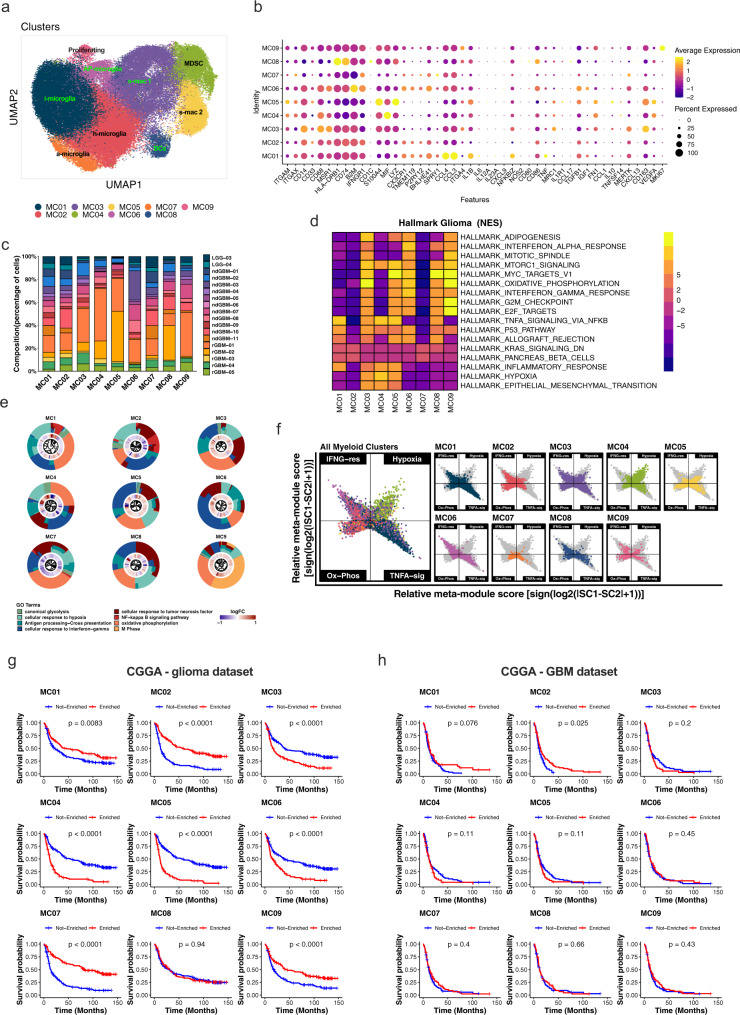
Fig. 4. Nine myeloid cell subtype signatures are predictive of patient survival.
Totally, 83,479 cells from clusters 1, 4, and 7 in Fig. 1b corresponding to myeloid cells were extracted and used for de novo clustering, identifying 9 myeloid clusters (MCs). a A UMAP projection of de novo clustered myeloid cells. Cells are color-coded by cluster numbers. Clusters are labeled with presumed activation states: i = inflammatory, a = activated, h = homeostatic, s = suppressive, AP = antigen presenting. b A dot plot showing the average expression of highlighted lineage marker genes across all myeloid clusters. c Fraction of cells from each cluster (x-axis) color-coded by patients. d A heatmap showing top and bottom two enriched GSEA Hallmark Pathways in each cluster (adj. p-value cutoff = 0.05). Genes were pre-ranked using the Wilcoxon rank-sum test and auROC. e Gene Ontology (GO) enrichment analysis with top differentially expressed genes (DEGs) among clusters. Plots show circular dendrograms of DEGs clustered by default Euclidean distance and average linkage. The inner ring displays logFC (blue is low, red is high). The outer ring represents assigned terms. Top terms were selected based on z scores and p-values for each cluster. f Two-dimensional butterfly plot visualizations of top Hallmark Pathways in different clusters (TNFA SIGNALING VIA NFKB, INTERFERON GAMMA RESPONSE, HYPOXIA, and OXIDATIVE PHOSPHORYLATION), representing signature scores as relative meta-module scores. Colors represent different clusters shown in (a). g, h Kaplan–Meier survival curves generated with each of MC signature genes using the Chinese Glioma Genome Atlas (CGGA) dataset. g All glioma patients (n = 325) or h GBM patients only (n = 139) were stratified by positive (Enriched) or negative (Not Enriched) signature scores for each MC. Zero cell score values were used as cutoffs for positive or negative designations. P-values on graphs from univariate log-rank Mantel–Cox test (exact p-value for (g) (all glioma) MC2 = 1.3e−12, MC3 = 4.3e−06, MC4 = 2.04e−14, MC5 = 2e−16, MC6 = 8.62e−07, MC7 = 5.51e−15, MC9 = 3.79e−05). Also see Supplementary Data 10 for multivariate Cox regression analysis p-values for: all gliomas (MC2 = 0.04, MC3 = 0.04, MC4 = 0.0007, MC5 = 0.0003, and MC7 = 0.002) and for GBM only (MC2 = 0.02, MC3 = 0.049, and MC07 = 0.03). Source data for c, g, and h are provided as Source Data files.

