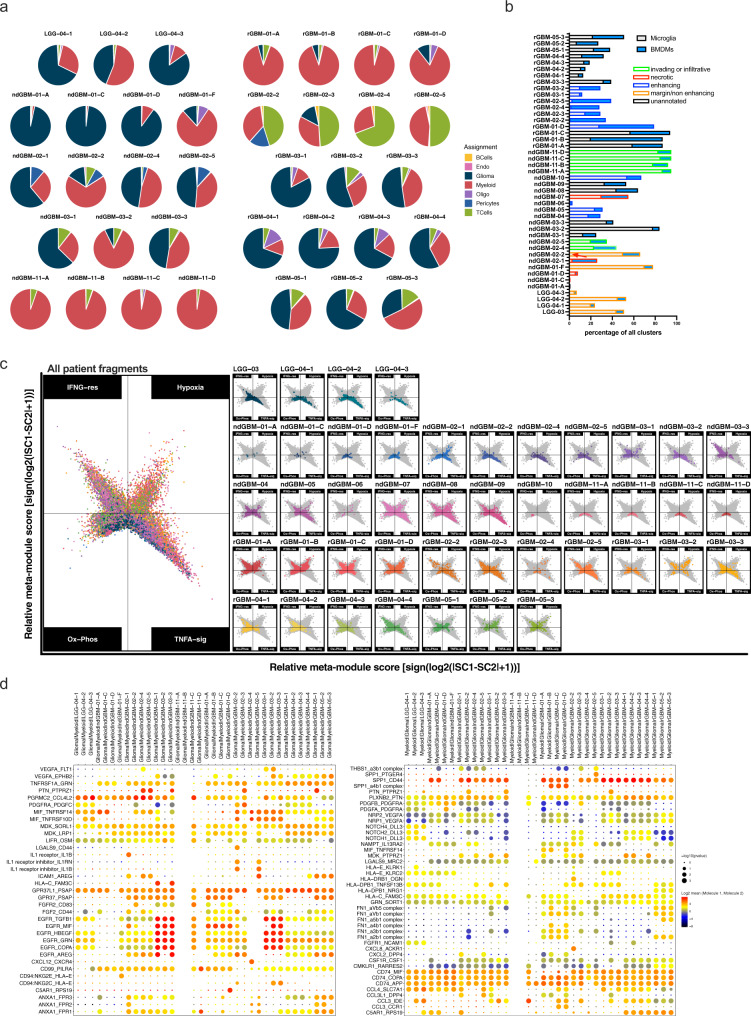
Fig. 5. Presence of spatially heterogeneous glioma and immune cell types results in the unique cell:cell interactions in the local microenvironment.
Multi-regional samples from ten glioma patients were analyzed separately by fragment. a Pie charts representing the percentage of cells per assignment by patient fragment was color-coded for cell type assignment. b bar graph showing the percentage of microglia and BMDMs in different fragments. Patient fragments are highlighted with borders: red = necrotic, blue = enhancing, orange = margin or non-enhancing and green = invading or infiltrative. c Two-dimensional butterfly plot visualization of top Hallmark pathways in myeloid cells (TNFA SIGNALING VIA NFKB, INTERFERON GAMMA RESPONSE, HYPOXIA, and OXIDATIVE PHOSPHORYLATION) in different fragments, representing signature scores as relative meta-module scores. Colors represent different fragments. d Cell–cell communication analysis using CellphoneDB. Depicted are the dot plots of ligand-receptor pairs for Glioma-Myeloid (left) and Myeloid-Glioma (right) signaling across all glioma patients. Each dot size shows the −log10 p-value and color indicates the log2 mean of expression values for the listed LR pairs (y-axis) in the respective interacting cell types (x-axis, top). Dot colors represent log2 mean interaction. Only significant LR pairs, with cutoffs of p-value ≦ 0.05 and log2 mean expression value >2, are shown. The p-values were generated by CellphoneDB which uses a one-sided permutation-test to compute significant interactions. Source data for a and b are provided as a Source Data file.

