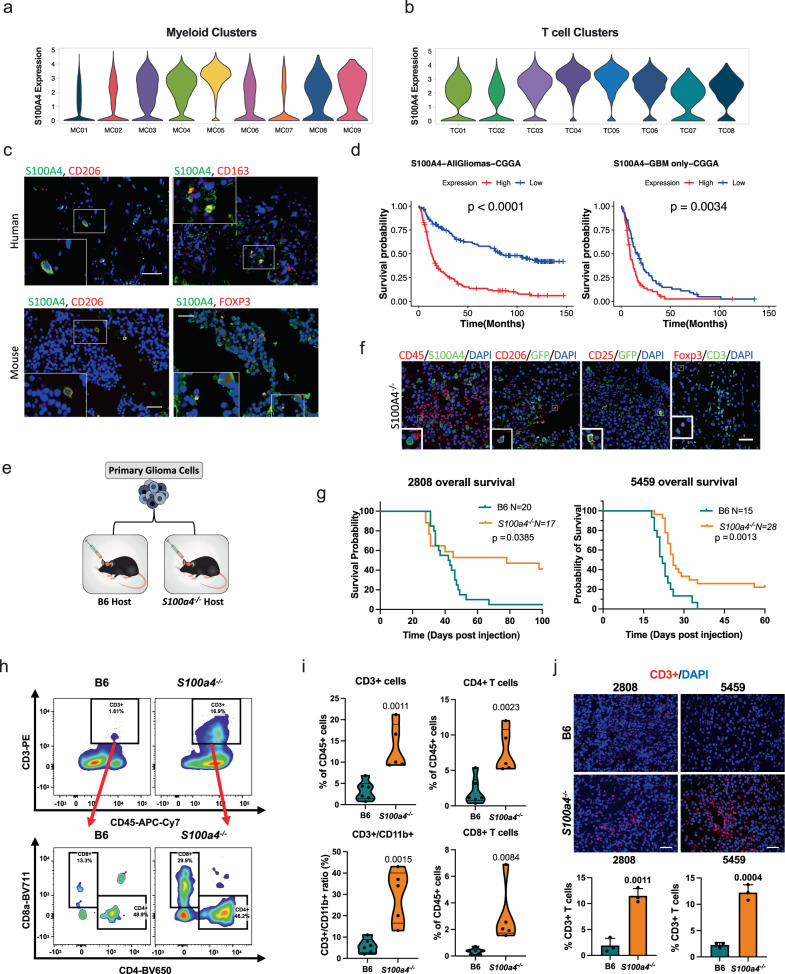
Fig. 6. S100A4 promotes immune suppression and glioma growth.
a, b Violin plots showing S100A4 expression levels in human glioma-associated myeloid cells (a) with high expression in immune-suppressive MCs (MC3–MC5) and glioma-associated TCs (b) with highest expression in TC04 and TC05, Treg and exhausted CD4 T cells. Violin plots are color-coded by corresponding myeloid and T cell clusters in Figs. 3 and 4). c Representative double immunofluorescence images showing co-expression of CD206, CD163, or FOXP3 (red) with S100A4 (green) in human GBMs (top) and mouse glioma (bottom). n = 6 patients, n = 3 B6 mice. Scale bar: 50 µm. d Kaplan–Meyer survival curve with differential S100A4 expression levels in all glioma patients (left: n = 325, 163 high and 162 low) and GBM patients only (right: n = 139, 67 high and 72 low) from the CGGA dataset, stratified by median S100A4 expression level. P-values from Log-rank Mantel–Cox test. e Functional validation experimental design: mouse primary glioma tumorspheres isolated from spontaneous S100ß-vErbB;p53 glioma models (5459 or 2808) were intracranially injected into sex- and age-matched B6 or S100a4−/− host mice. f Representative doubles IF images showing co-expression of CD45, CD25, or CD206 with S100A4/GFP in mouse tumors from S100a4−/− hosts. n = 3 each. Scale bar: 50 µm. g Kaplan–Meier survival curves showing significant survival extension of S100a4−/− host mice, compared to B6 hosts, intracranially injected with the same primary glioma tumorsphere cells: 5459 (B6 n = 15, S100a4−/− n = 28) or 2808 (B6 n = 20, S100a4−/− n = 17). P-values from Log-rank Mantel–Cox test. h Representative dot plots from flow cytometry analysis of tumor-infiltrating T-cells in B6 vs. S100a4−/− host mice. i Flow cytometry analysis n = 6 (B6) and n = 5 (S100a4−/−) mice. All pairwise analyses were performed using two-tailed t-tests. j Representative Immunofluorescence images of CD3+ T cells in B6 control and S100a4−/− host gliomas. CD3+ (red) and DAPI (all nuclei in blue) were counted from three fields/sample and three samples/type. Error bars represent SD. P-values represent two-tailed t-tests. Scale bar: 100 µm. Source data for d, g, i, and j are provided as a Source Data file.

