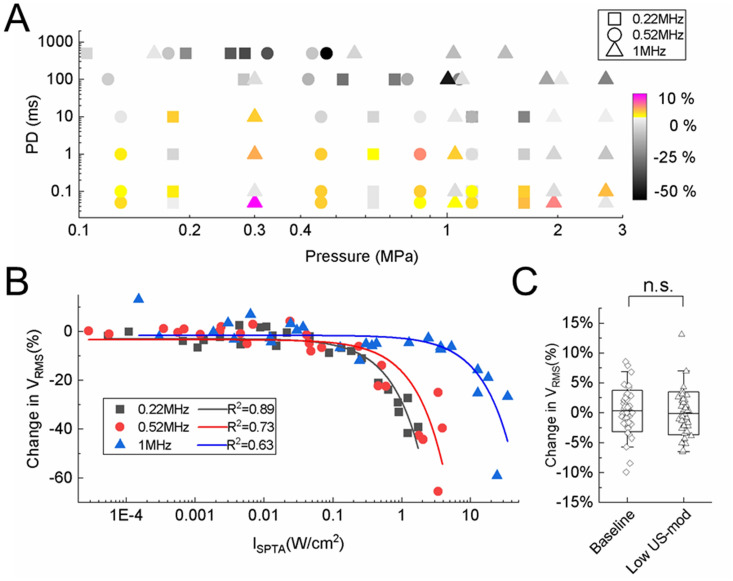
Figure 4.
US modulation effects on the sciatic nerve for a wide range of US parameters. (A) Parameter response map of pressure and PD space. As PD and pressure increased, US modulation shifted from enhancement or suppression to predominantly suppression effects. (B) Change in VRMS is plotted as a function of intensity (ISPTA). Modulation effects shifted from both enhancement and suppression to only suppression as ISPTA increased. Lower center frequencies required lower intensities to achieve the same amount of suppression as achieved for higher center frequencies. Based on the curve fits, to elicit a suppression of 50% over 100 trials (1 s TD), it would require 8.33, 11.15, and 32.49 W/cm2 with the 0.22, 0.52, and 1 MHz transducer, respectively. Data acquired across five animals. (C) Comparison between the change in VRMS (mean ± SD) of the baseline paradigm and the US-mod paradigm using low intensities (ISPTA), which are 0.01, 0.02, and 0.04 W/cm2 for the 0.22, 0.52, and 1 MHz transducer, respectively (i.e., portion of the curve where both enhanced and suppressed responses are observed and below intensities where responses become noticeably suppressed). Data were pooled from total sessions (specified as m below) across different animals (specified as n below). The control group (m = 49, n = 16; black) was not significantly different (p = 0.18) from the low US-mod group (m = 41, n = 7; blue), and the distribution of points were similar across groups. The 0.22, 0.52, and 1 MHz transducers were used. n.s., not significant. Data are represented as mean ± SD.

