Figure 5.
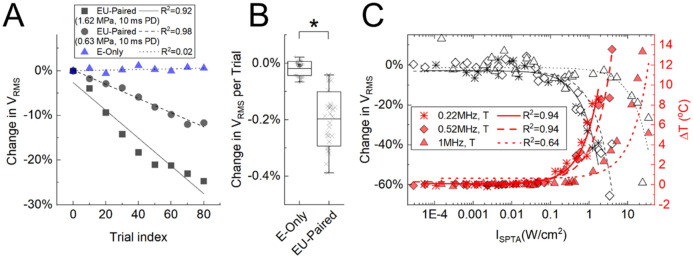
Cumulative suppression of nerve activity over time and increases in temperature during US stimulation. (A) Compound action potentials (CAPs) were averaged over a 20-trial window moving forward at a step of 10 trials, spanning a total of 100 trials. Changes in VRMS were calculated by comparing the averaged CAP of the moving window with that of the first window and are plotted as a function of the start time of each window in A. Examples for E-only (blue) and EU-paired (1.62 or 0.63 MPa, 10 ms PD, 1 s TD) are plotted. (B) Changes in VRMS per trial (mean ± SD) for EU-paired groups were significantly lower than E-only groups across 29 sessions in three animals (*p = 5.5E-15, -0.20 ± 0.10% versus -0.01 ± 0.03%). The 0.22 MHz transducer was used in A and B. (C) Changes in VRMS (black; same data as in Fig. 4B) and temperature (red) are plotted as a function of intensity (ISPTA) for the 0.22, 0.52, and 1 MHz transducers. Greater nerve suppression was observed at higher ISPTA, which corresponded to larger increases in nerve temperature. Data are represented as mean ± SD.

