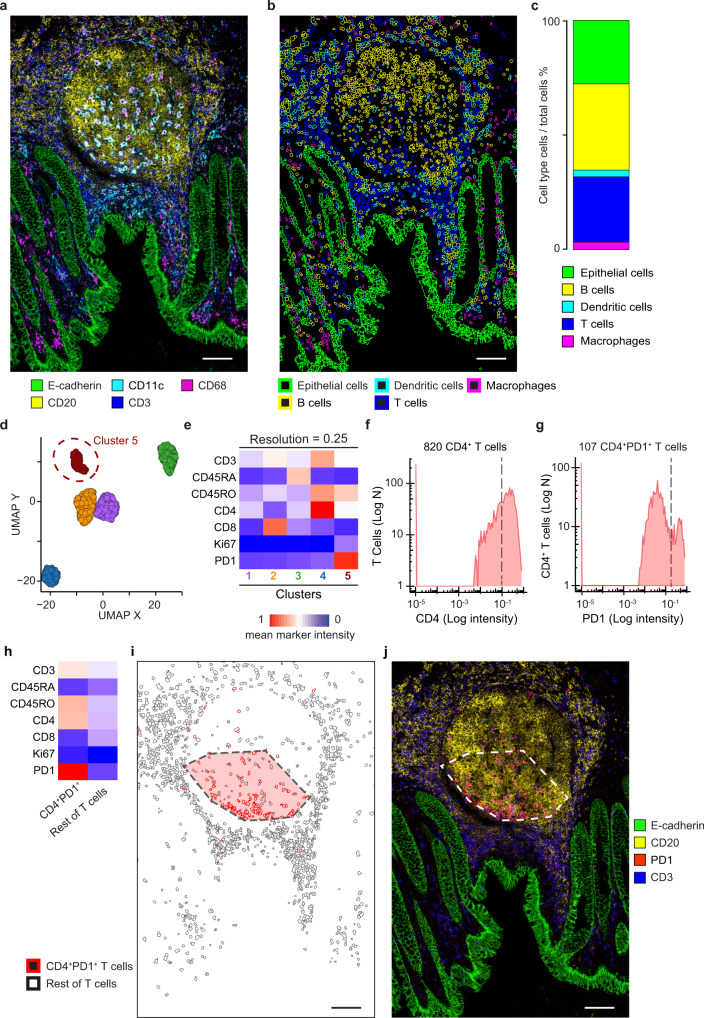
Fig. 3. Single-cell characterisation of T cells in a human germinal centre.
a IMC image of a normal appendix (APP1) showing a central germinal centre with the columnar epithelium delimiting the appendiceal lumen. b Outlines of T cells, B cells, macrophages, dendritic and epithelial cells identified through the highest overlap with the respective masks. c Proportions of T cells, B cells, macrophages, dendritic and epithelial cells over all cells. d UMAP plot of 1466 T cells grouped in five clusters resulting from unsupervised clustering according to the expression of seven markers of T cell function (Supplementary Data 2). Cluster 5 (circled) corresponds to PD1+CD4+ T cells. e Expression profiles of the five clusters identified in (d). The mean intensity value of each marker across all cells is reported. The colour scale was normalised across all markers and cells. f Density plots of CD4 expression in T Cells. Cells with ≥0.1 CD4 expression were considered as CD4+ T cells. g Density plot of PD1 expression in CD4+ T cells. Cells with ≥0.15 PD1+ expression were considered as PD1+CD4+ T cells. Thresholds for CD4 and PDL1 were identified through histological inspection of the PD1 channel images. h Expression profiles of the PD1+CD4+ T cells and the rest of T cells. For both populations, the mean intensity value of each marker across all cells is shown. The colour scale was normalised across all markers and cells. i Position map of T cells within the ROI. The area of a high-density cluster of ≥5 PD1+CD4+ T cells per 10,000 μm2 is highlighted in red. j IMC image showing the localisation of the PD1 signal within the ROI. Images in (a), (b), (i), and (j) were derived from a single experiment (APP1, Supplementary Data 1). Panels (a), (b), (c), (i), and (j): E-cadherin and epithelial cells, green; CD11c and Dendritic cells, cyan; CD68 and macrophages, magenta; CD20 and B cells, yellow; CD3 and T cells, blue; PD1 and PD1+CD4+ cells, red. Panels (d) and (e): cluster 1, violet; cluster 2, orange; cluster 3, green; cluster 4, blue; cluster 5, red. Scale bar for all images = 100 μm. Source data are provided as a Source Data file.

