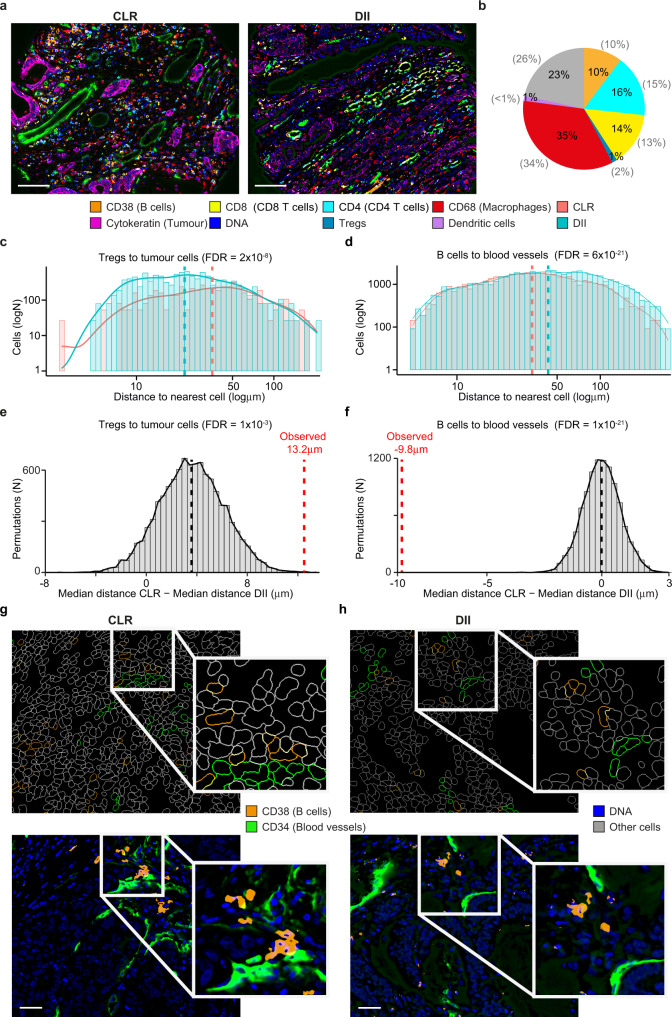
Fig. 5. Spatial localisation of immune cells in two colorectal cancer subtypes.
a CODEX images of two representative CLR (CRC_12_24) and DII (CRC_31_16) colorectal cancer samples. b Proportions of CD8+ T cells, CD4+ T cells, Tregs, macrophages, dendritic cells, B cells and other mixed immune cell populations across the 35 analysed samples. Cell types were identified by applying expert-defined thresholds to the expression intensity of representative markers and normalised over the total non-cancer cells. These thresholds were derived through histological inspection of the channel images. The cell proportion corresponding to each population from the original study9 is reported in brackets. Distance distribution of Tregs to the nearest tumour cell (c) and of B cells to the nearest endothelial cell (d) of CLR and DII samples. Distances between cell pairs were calculated using the cell centroids coordinates and the resulting distributions were compared between CRC subtypes using a two-sided Wilcoxon test. Benjamini–Hochberg FDR correction was applied for testing over ten cell type comparisons. Only differences of at least 8 µm and with FDR < 0.1 were considered significant. Dashed lines represent the medians of the distributions. Distribution of the expected differences between the median distances of Tregs to the nearest tumour cell (e) and of B cells to the nearest endothelial cell (f) in CLR and DII samples. Expected values were calculated with a permutation test, where cell identities were randomly reassigned for 10,000 times within each sample. The resulting median values were compared to the observed differences with a two-tailed permutation test adjusted for multiple hypothesis testing with the Benjamini–Hochberg correction. Single-cell outlines of B cells and blood vessels (upper panel) and associated images (lower panel) form a representative CLR (CRC_17_34) (g) and DII (CRC_15_29) (h) sample out of 35 colorectal cancer samples (Supplementary Data 1). CD38 and B cells, orange; CD8 and CD8+ T cells, yellow; CD4 and CD4+ T cells, cyan; CD68 and macrophages, red; cytokeratin and tumour cells, magenta; DNA, blue; Tregs, teal; dendritic cells, violet. Crohn’s-like reaction (CLR) orange; diffuse inflammatory infiltration (DII), teal. Scale bar = 100 μm. Source data are provided as a Source Data file.

