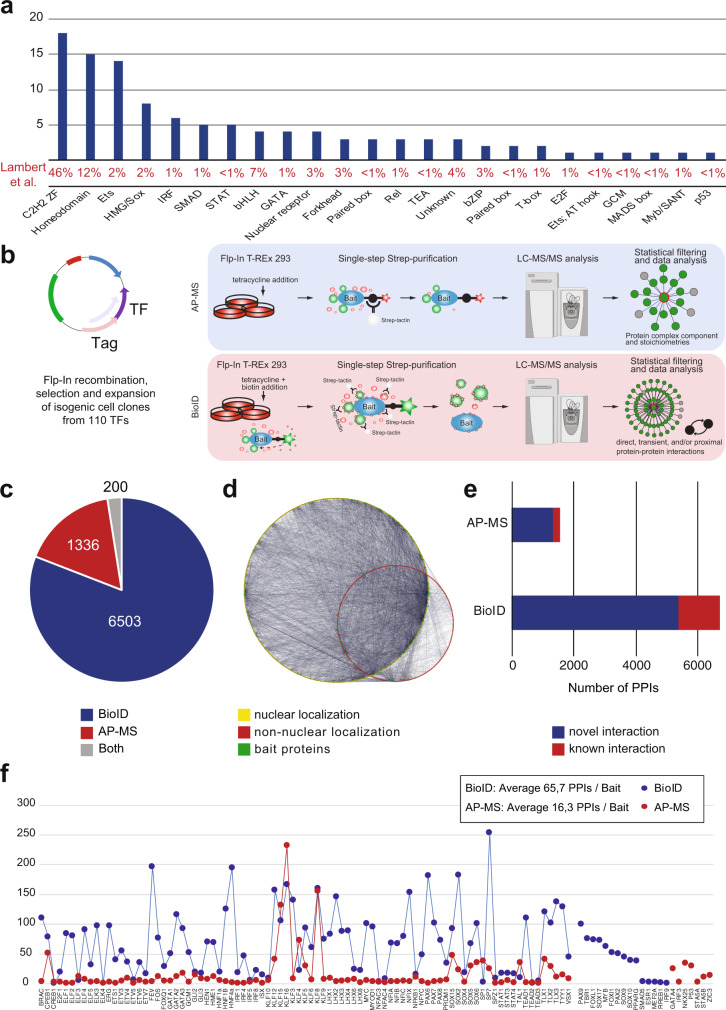
Fig. 1. TF protein interactome identified using the BioID and AP-MS methods.
a The distribution of the DNA-binding domains of the studied TFs. The corresponding proportion of each DNA-binding domain from 1639 TFs in the study of Lambert et al. is shown as a percentage value below the graph. b Schematic illustration of the analysis methods used to comprehensively map the physical and functional interactions formed by the TFs. The TFs were tagged N-terminally with MAC, StrepIII-HA or BirA -tags (Supplementary Data 1a) and cotransfected with Flp-In recombinase to generate stable isogenic and inducible cell lines. Cells were induced by tetracycline addition for the corresponding TF expression and for the BioID analysis supplemented with biotin for 24 h. This was followed by cell harvesting, lysis, and affinity purification with Strep-beads. Purified proteins were further digested into peptides and analyzed by LC–MS/MS. Proteins were later identified, quantified, and analyzed to distill the high-confidence interactors using different statistical and bioinformatic methods. c A total of 6503 high-confidence protein–protein interactions were detected only with the BioID method, 1336 with the AP-MS method, and 200 with both the BioID and AP-MS methods. d Localization of interacting prey-proteins from BioID data according to the annotated localizations of Cell Atlas12. Yellow nodes (large circle) indicate nuclear localization, and red (small circle) indicates nonnuclear localization. Of the mapped proteins, >80% had nuclear localization. e Protein–protein interactions were identified using the AP-MS (1536) and BioID (6703) methods. Interactions were compared to interactions from the PINA2, IntAct, BioGRID, and String experimental protein interaction databases and to interactions from a study by Li et al.6, by Lambert et al.25, Malovannaya et al.26, and Huttlin et al.27 resulting in 220 and 1316 previously reported interactions in the AP-MS and BioID data, respectively. The proportions of known interactions are shown in red. f Number of high-confidence protein–protein interactions of different TF baits detected by AP-MS (red) or BioID (blue) affinity purification combined with mass spectrometry. Source data of the figure are provided as a Source Data file.

