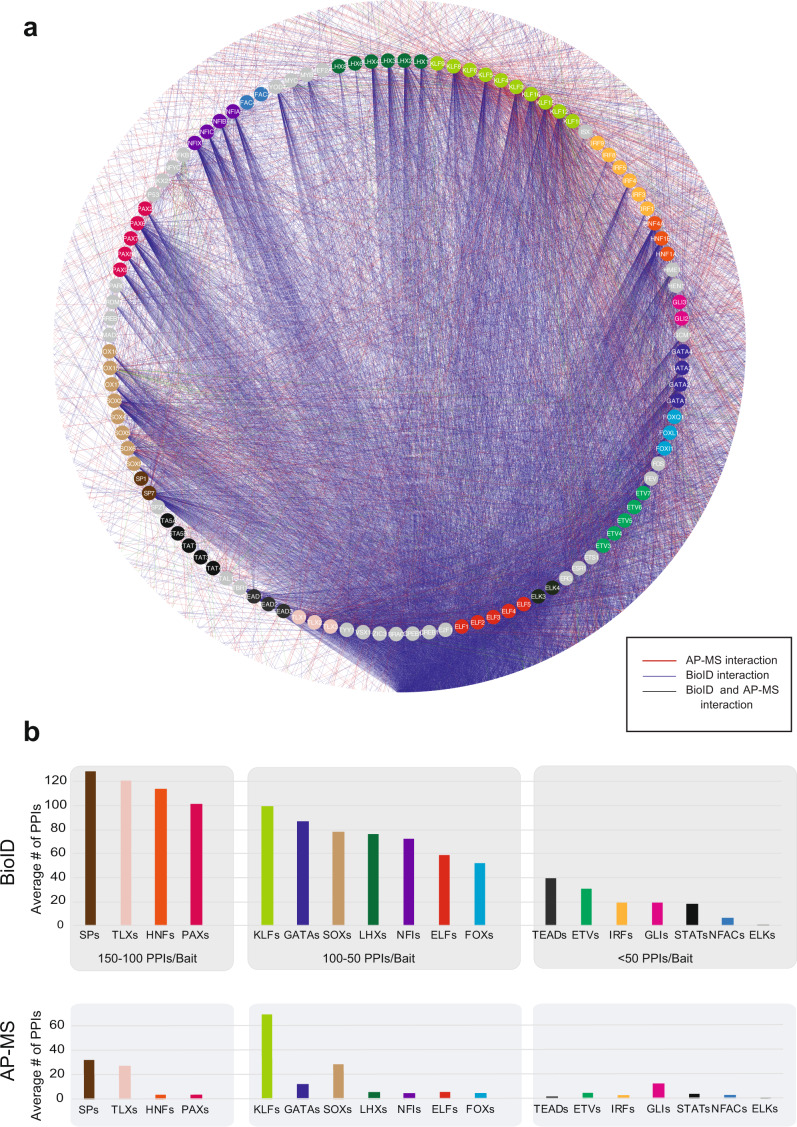
Fig. 2. Comprehensive protein interactomes of the studied TF and TF families.
a Studied TFs are organized and color-coded (node color) based on their TF families in the inner circle, and interacting proteins are shown in the outer circle with white. Blue edges indicate interactions detected with the BioID analysis, red with the AP-MS analysis and green from both. b The average number of PPIs of different TF families detected by BioID and AP-MS. Note that the color coding of the TF families is the same as in a) and the TF families are organized into three bins based on the BioID data, first having families with 150-100 high-confidence interactions/bait TF, second 100-50, and third <50 interactions/TF. The stable interactions detected with AP-MS showed a correlation with the interaction numbers; however, the KLF family behaved differently, with a more than 2-fold higher number of average interactions than any other TF family. Source data of the figure are provided as a Source Data file.

