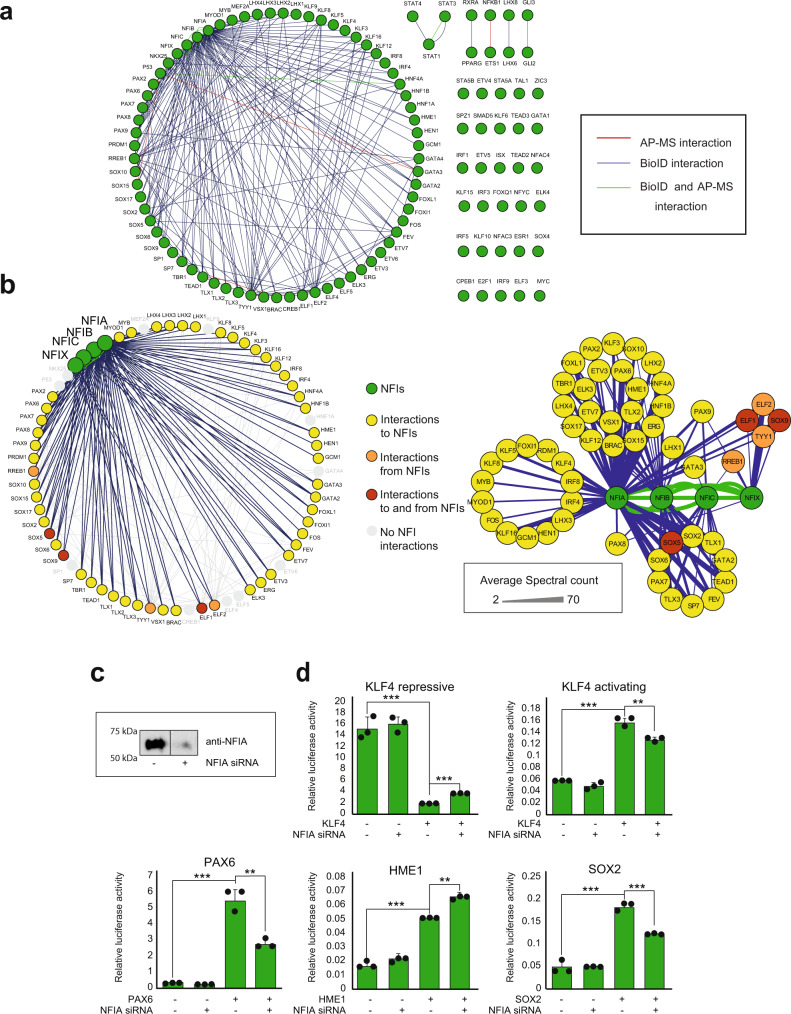
Fig. 4. TF-TF (bait-bait) interactions of 109 TFs studied.
a Of 109 studied TFs, 80 had 202 interactions with other studied TFs. Blue edges indicate interactions from the BioID analysis, red from the AP-MS analysis and green from both. b Most of these TF-TF (118) interactions were TF interactions with NFIs (left panel). The right panel shows the separate groups shared by one or multiple NFIs. Color code: Green nodes = NFIs, yellow nodes = interactions to NFIs, orange nodes = interactions from NFIs, red nodes = interactions to and from NFIs and gray nodes = no interactions to or from NFIs. Color coding of the nodes is shown on the right side of the figure. The edge weight displays the average spectral count value detected for the corresponding interaction. c NFIA was silenced using siRNA transfection, and NFIA levels were detected 48 h after transfection by western blotting using a specific antibody against NFIA. d TF activity was investigated after NFIA silencing using both repressive and activating reporter gene analysis. Both the repressing and activating functions of KLF4 were reduced upon NFIA silencing. In addition, SOX2 and PAX6 activity was reduced, while HME1 activity was increased upon NFIA silencing. The representative data from two repeated experiments are presented as mean values +SD as appropriate. Two-sided t-test was used. N = 3, ***p < 0.001, **p < 0.01, *p < 0.05. Source data of the figure are provided as a Source Data file.

