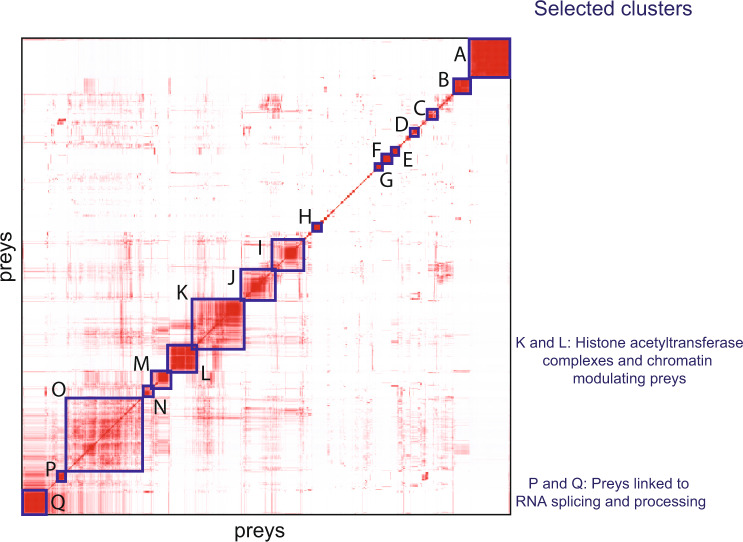
Fig. 5. Biological clusters from prey-prey correlation analysis.
Prey-prey correlation analysis (ProHits-viz.) of prey identified in the BioID experiments. The results are shown in the heatmap with prey on both the x- and y-axes. Prey in clusters (A-Q) and baits driving the clusters are shown in Supplementary Data 6. The color scale indicates the Pearson correlation of prey PSMs that was performed by Prohits-viz. prior to hierarchical clustering. Source data of the figure are provided as a Source Data file.

