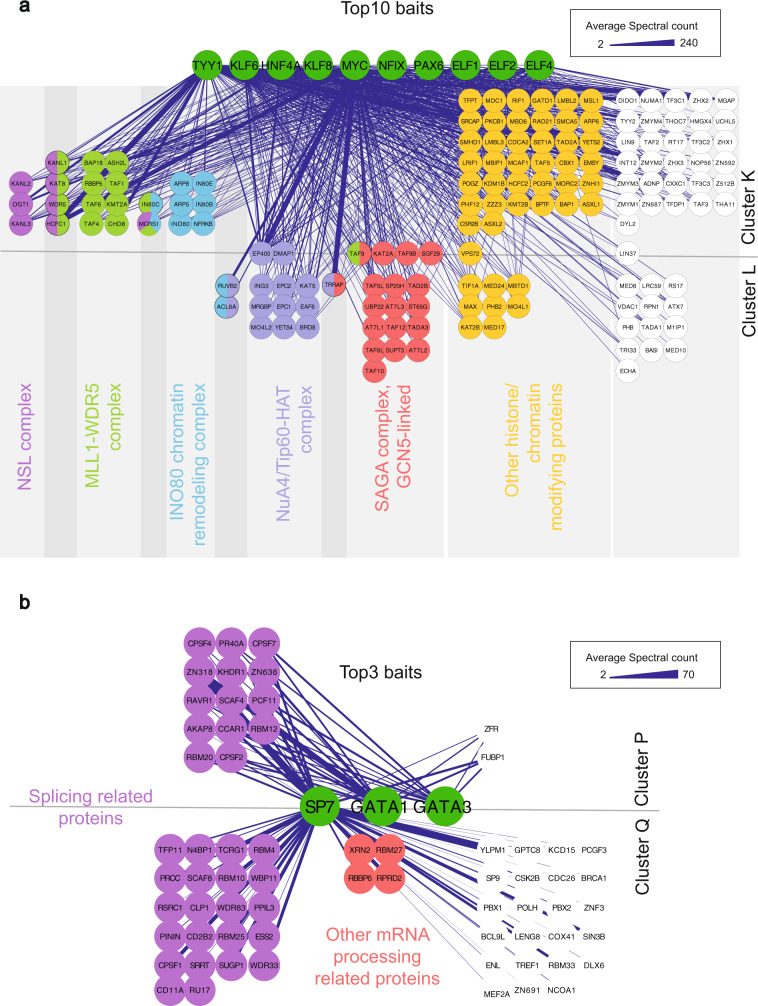
Fig. 6. The interactions in Clusters K, L, P, and Q of the prey-prey correlation analysis from BioID experiment.
a The ten baits (TYY1, KLF6, HNF4A, KLF8, MYC, NFIX, PAX6, ELF1, ELF2, and ELF4) with the most interactions in Clusters K and L are shown in the top of the figure with green nodes. Most of the preys in Clusters K and L belong to different chromatin-modulating complexes that are highlighted by color coding. b Protein–protein interactions in Clusters P and Q. The three baits (SP7, GATA1, GATA3) with the most interactions in Clusters P and Q are shown in the center of the figure with green nodes. Most of the preys in these clusters were linked to mRNA splicing (highlighted in purple). The edge weight displays the average spectral count value detected for the corresponding interaction. Source data of the figure are provided as a Source Data file.

