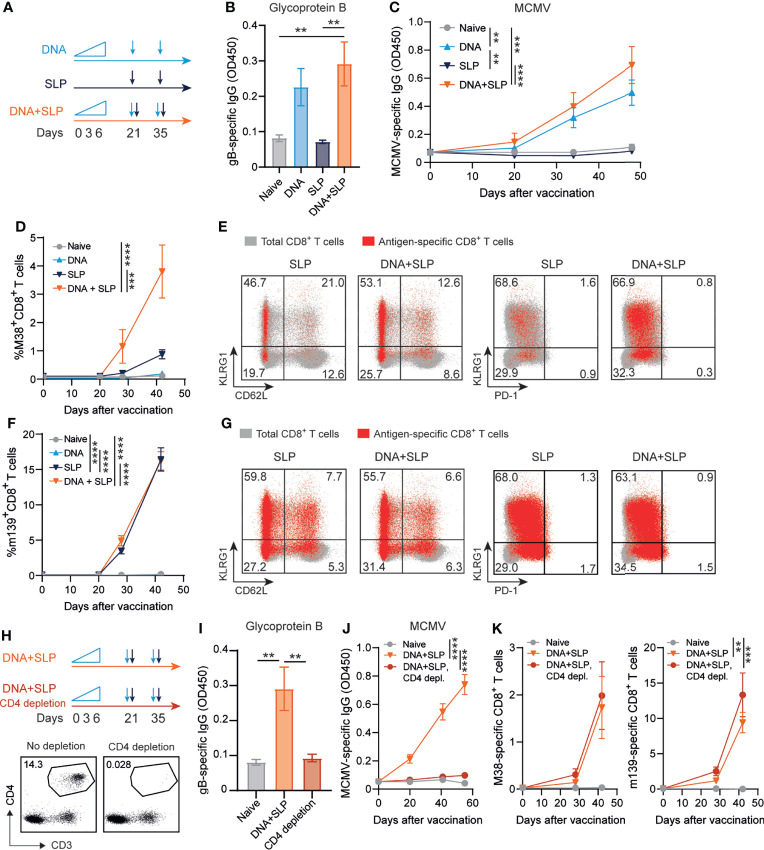
Figure 3.
Combining the sgB DNA vaccine with synthetic long peptide vaccines enhances antibody and CD8+ T cell responses. (A) Vaccination schedule for mice vaccinated with the sgB DNA vaccine and/or the SLP vaccine. The sgB DNA vaccine was intradermally with an increasing dose prime schedule (10 µg on day 0, 20 µg on day 3 and 30 µg on day 6) followed by two booster immunizations with 60 µg. The SLP vaccine (synthetic long peptides containing the M38 and m139 class I epitopes, adjuvanted with CpG) was provided subcutaneously on day 21 and day 35. (B) Glycoprotein B-specific IgG response on day 72 after vaccination in blood. Data shown are mean values ± SEM (n=8). One-way ANOVA was used for statistical analysis. (C) Kinetics of the MCMV-specific IgG response in serum over time. Data shown are mean values ± SEM (n=8). One-way ANOVA on day 48 was used for statistical analysis. (D, F) Kinetic analysis of the M38- (D) and m139-specific (F) CD8+ T cell response. Data shown are mean values ± SEM (n=8). One-way ANOVA on day 48 was used for statistical analysis. (E, F) Representative flow cytometry plots showing the KLRG1 vs CD62L or KLRG1 vs PD-1 cell-surface expression on the total CD8+ T cells (gray) and M38- (E) and m139-specific (G) CD8+ T cells (red) in blood at day 7 post-boost vaccination. Indicated percentages are representative values for each group. Experiments were performed twice with similar outcome. (H) Vaccination schedule for mice vaccinated with the sgB DNA vaccine and the SLP vaccine with and without CD4+ T cell depletion during the vaccination period. The vaccines were administered as described in (A). The CD4+ T cell depleting antibody was administered s.c. every six days. Representative flow cytometry plot showing confirmation of CD4+ T cell depletion in blood. (I) Glycoprotein B-specific IgG response on day 72 after vaccination in blood. Data shown are mean values ± SEM (n=9). One-way ANOVA was used for statistical analysis. **P<0.01. (J) Kinetics of the MCMV-specific IgG response in serum over time. Data shown are mean values ± SEM (n=9). One-way ANOVA on day 55 was used for statistical analysis. (K) Kinetic analysis of the M38- and m139-specific CD8+ T cell response. Data shown are mean values ± SEM (n=8). One-way ANOVA on day 42 was used for statistical analysis. **P<0.01, ***P<0.001, ****P<0.0001.

