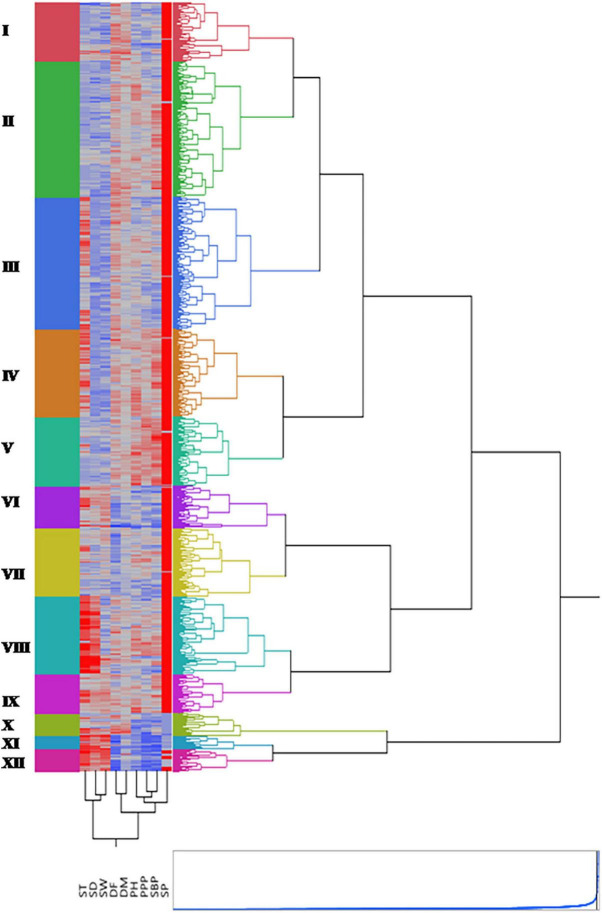
FIGURE 7.
Dendrogram along with heatmap of entire germplasm generated by performing hierarchical cluster analysis. Twelve clusters are represented by different colors. The two-dimensional heatmap is represented by columns and rows. Each column represents different quantitative trait and each row an accession. The higher the trait value, the brighter is the red and similarly, lower the trait value, brighter is the blue color, respectively.

