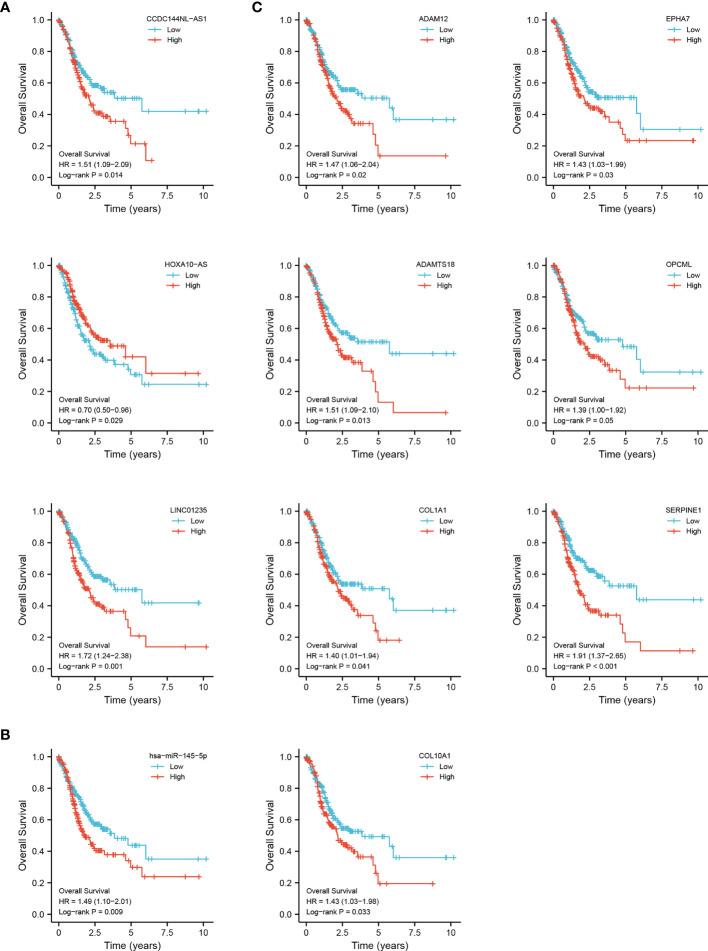
Figure 3.
Overall survival analysis for the DEGs in the triple regulatory network. The high-expression and low-expression values of 11 survival-related genes were compared by a K-M survival curve for TCGA STAD patient cohort. (A) 3 DElncRNAs. (B) 1 DEmiRNA. (C) 7 DEmRNAs. The horizontal axis indicates the overall survival time in years, and the vertical axis represents the survival rate.

