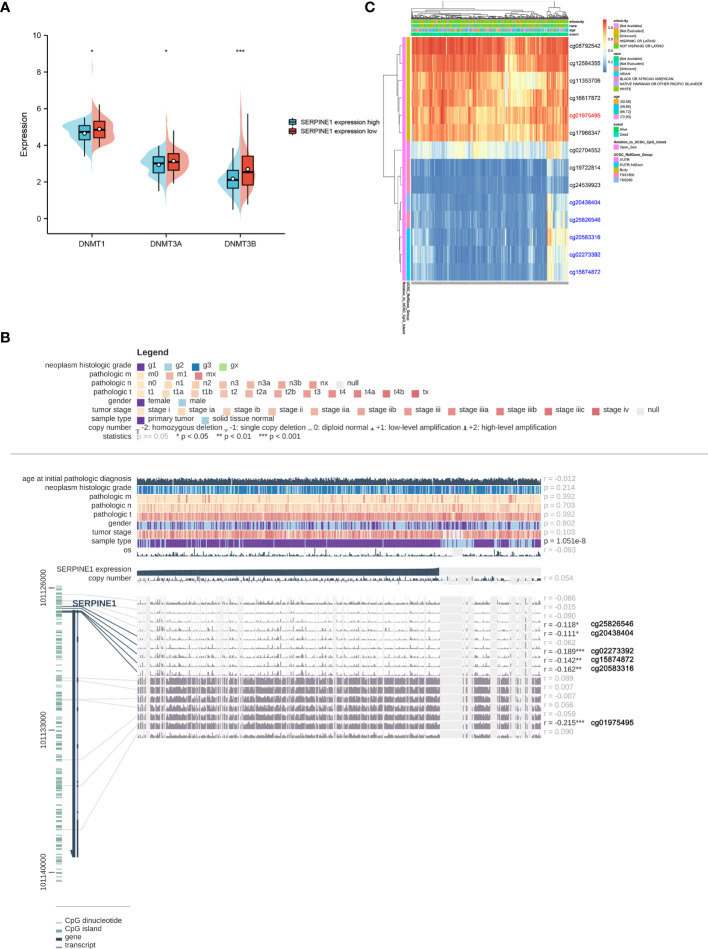
Figure 9.
Methylation analysis of SERPINE1. (A) Differential expression of three DNA methyltransferases (DNMT1, DNMT3A and DNMT3B). (B) The methylation site of SERPINE1 DNA sequence association with gene expression was visualized using MEXPRESS. The blue line illustrates the expression of SERPINE1 in the center of the plot. Pearson’s correlation coefficients and p values for methylation sites and query gene expression are shown on the right side. (C) Differently methylated regions associated with SERPINE1 were presented by heatmap using MethSurv.

