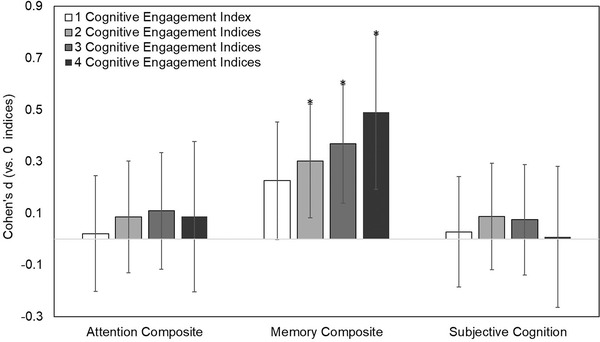
FIGURE 2.

The magnitude of difference between individuals who rated highly in zero cognitive engagement indices (educational attainment, occupational complexity, frequency of social engagement, and variety of leisure activities) versus those who rated highly in one, two, three, or four cognitive engagement indices on Attention and Memory composites and subjective ratings of cognition. Note: Error bars are 95% confidence intervals. Effect sizes marked by * are statistically significant at P < .05
