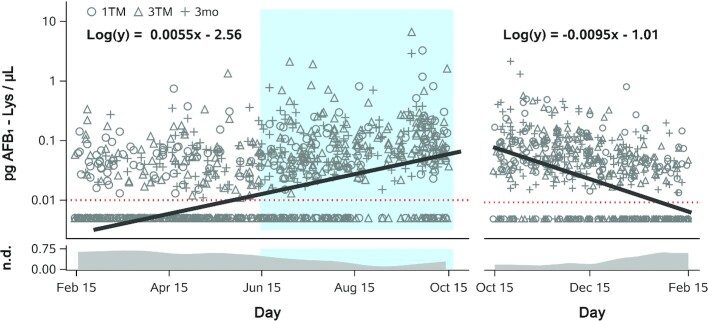
FIGURE 5.
Rates of seasonal change in AFB1-lysine (Lys) internal dose in Bangladeshi women. Censored linear regression of AFB1-lysine adduct concentration (log10-transformed) compared with day of sample collection during the dry and rainy seasons (left) or winter season (right), across all maternal sample types (1TM, 3TM, 3mo) and years of sample collection (2008–2011). Blue shading indicates the timing of the rainy reason. Units of the independent variable was the number of elapsed days relative to 15 February in the dry and rainy seasons (242 days total) or relative to 15 October in the winter season (123 days total). Censored regression best-fit lines and equations are shown for dry + rainy and winter seasons separately. Both slopes are significantly different from 0 (P < 0.0001). Dotted red line indicates limit of detection (0.01 pg/µL); nondetectable values were imputed at 0.005 pg/µL. The daily proportion of samples with nondetectable AFB1-lysine concentrations is shown in the band plots at the bottom of the graph; data represent LOWESS curves fit to daily values. AFB1, aflatoxin B1; LOWESS, locally weighted scatterplot smoothing; n.d., not detected; 1TM, first trimester; 3mo, 3 mo postpartum; 3TM, third trimester.

