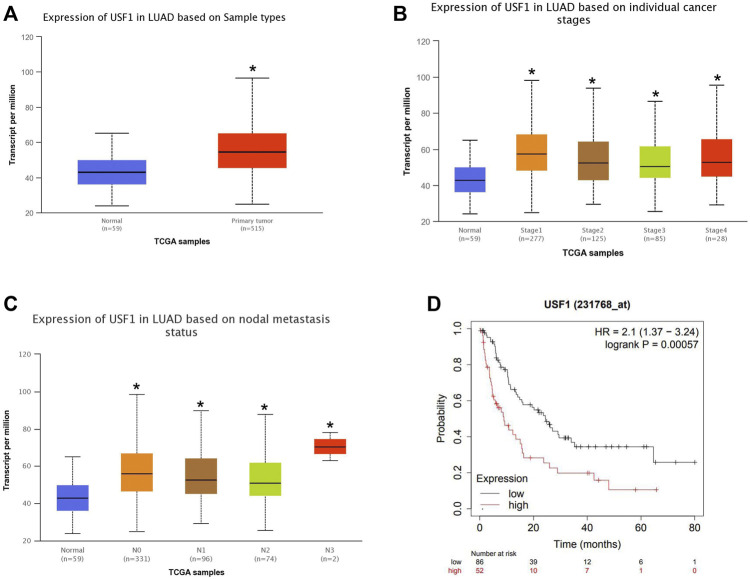
FIGURE 2.
Relationship between the USF1 expression and patients’ clinical data in the TCGA database. (A) USF1 expression data in LUAD and normal tissues as reported in TCGA; (B) USF1 expression data in the category “Clinical stage” in TCGA; (C) USF1 expression data in the category “Nodal metastasis status” as reported in TCGA; (D) USF1 expression data in regard to the post-progression survival (PPS) rates analyzed by Kaplan-Meier Plotter web tools (https://kmplot.com/analysis/).

