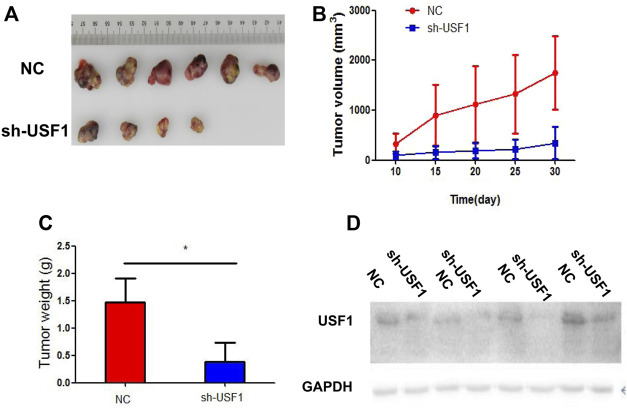
FIGURE 5.
Investigation of USF1 on LUAD progression in vivo. (A) Measurement of the xenograft tumor size in different groups, n = 12; (B) The xenograft tumor growth curve; (C) The weight of the tumor xenograft; (D) Transfection efficiency, determined by WB. (Controls were designated as the NC group and represented mice transfected with sh-NC; while sh-USF1 group mice stood for those transfected with sh-USF1; *p < .05 means statistically significant difference when compared with NC group).

