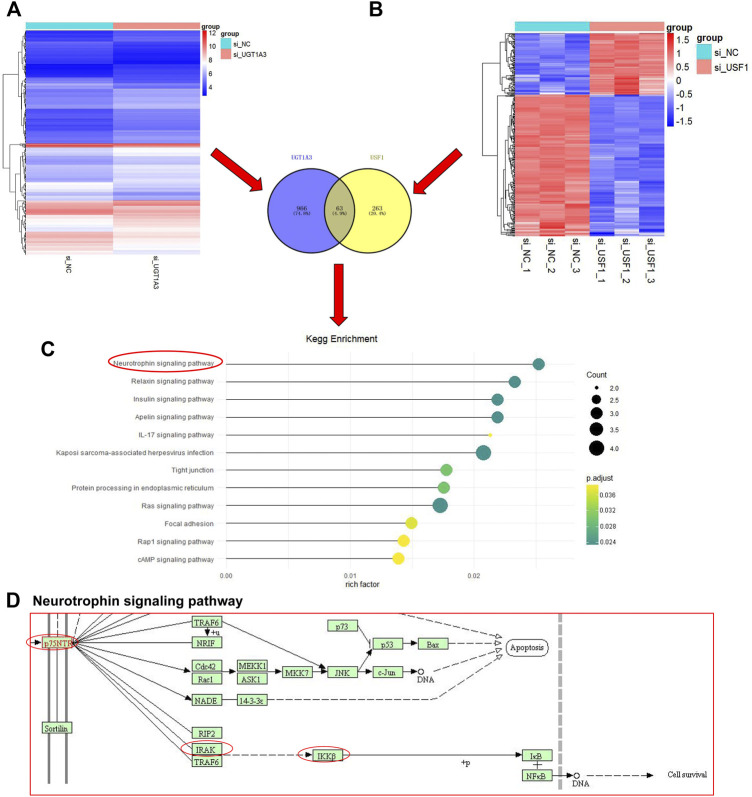
FIGURE 6.
Identification and KEGG pathway enrichment analysis of DEGs. The si-UGT1A3, group cells were transfected with UGT1A3; (A) DEGs in cells knockdown of UGT1A3 determined by DNA micro-assay; (B) DEGs in cells knockdown of USF1 determined by DNA micro-assay; Venn diagram of the overlapping genes USF1 and UGT1A3; (C) KEGG pathways enriched by DEGs; (D) Pathway signature protein predicted by STRING.

