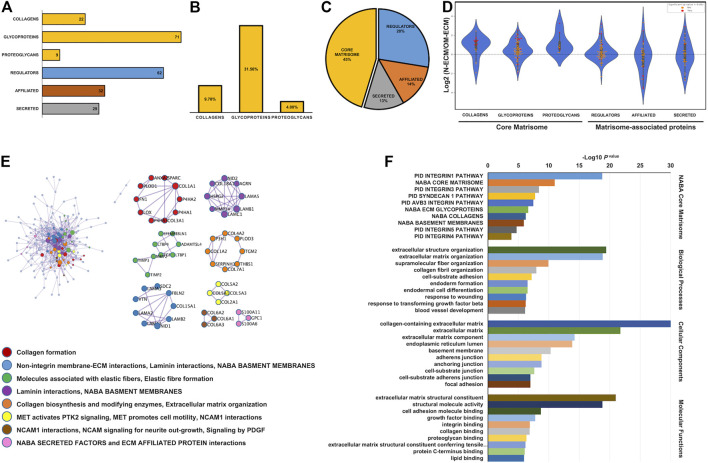
FIGURE 2.
Matrisome analysis of extracellular matrix derived from human dental pulp stem cells (DPSCs). Matrisome categories of the detected total proteins in both normal condition (N-ECM) and osteogenic differentiated condition (OM-ECM) derived from DPSCs by quantitative labelled free proteomics. (A) ECM derived from DPSCs in both conditions established the absolute number of different detected matrisome proteins. (B) The bar graph showed percentage of core matrisome (collagens, glycoproteins, and proteoglycans) and (C) matrisome associate proteins illustrated in pie chart (core matrisome, regulators, affiliated, and secreted). (D) Log2 ratio of these proteins obtained from N-ECM and OM-ECM was represented in a violin plot according to the matrisome categories. Red dots represent statistically significant ratios between the two conditions (p-value <0.05). Network analysis of protein–protein interaction (PPI) and biological enrichment analysis of ECM derived from DPSCs. (E) The diagram showed all high-confidence PPI by metascape analysis and the meanings of network component of PPI using GO enrichment analysis. The nodes color was applied to each protein network. (F) Reactome biological pathway and process enrichment analysis. Gene Ontology enrichment analysis of protein involved in NABA matrisome pathway, cell component, molecular function, and biological process. The bar plot showed the enrichment scores (−log10 [p-value]) of the significant difference.

