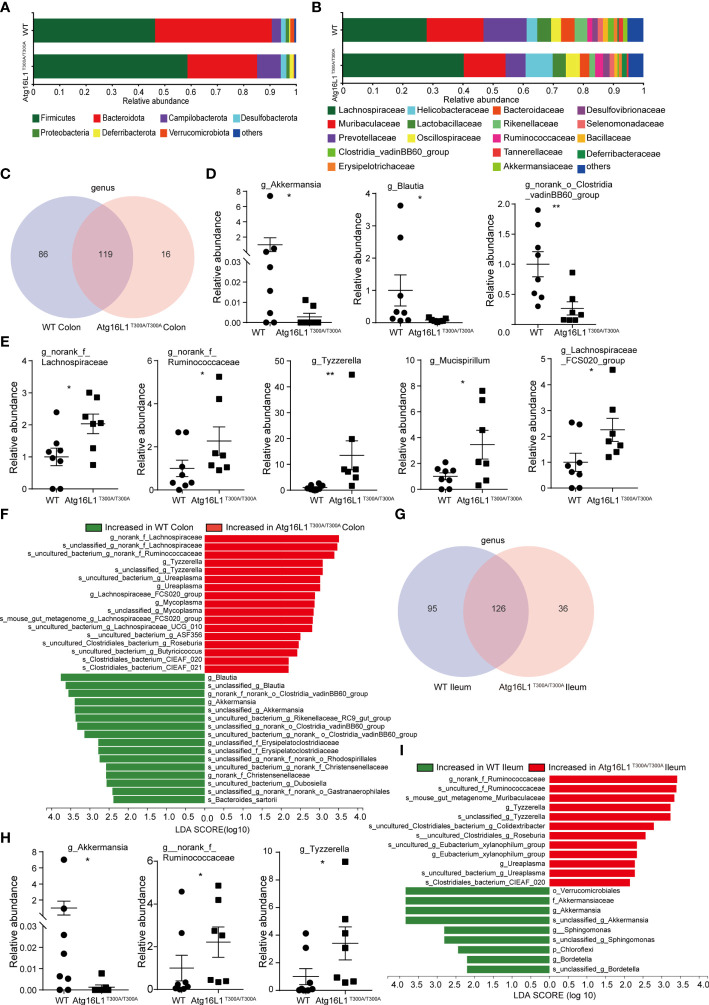
Figure 2.
Colonic and distal ileum mucosa microbial communities are altered in Atg16L1T300A/T300A mice. WT and Atg16L1T300A/T300A mice were cohoused in the SPF facility for 4–5 weeks after weaning at the third week of birth (WT mice n = 8 and Atg16L1T300A/T300A mice n = 7). Mice sacrificed after being cohoused for 4–5 weeks and whole colon and distal ileum excised. DNA was extracted from the colonic mucosa lining, and 16S rRNA gene sequencing was performed to profile bacterial taxa in each group. (A, B) The relative abundance of dominant bacteria at phyla- (A) and family- (B) level microbiota composition in colonic mucosa. Colored bars represent the relative abundance of particular taxa averaged in each group. (C) Venn diagram showing unique and shared genus among the WT and Atg16L1T300A/T300A mouse colon mucosa. (D) Relative abundance of Akkermansia, Blautia, and norank_o_Clostridia_vadinBB60_group genus in WT and Atg16L1T300A/T300A mouse colon mucosa scraping samples. Each dot represents an individual mouse sample. (E) Relative abundance of norank_f_Lachnospiraceae, norank_f_Ruminococcaceae, Tyzzerella, Mucispirillum, and Lachnospiraceae_FCS020_group genus in WT and Atg16L1T300A/T300A mouse colon mucosa scraping samples. Each dot represents an individual mouse sample. (F) Histogram of LDA value distribution identified by LEfSe analysis of colon mucosa scraping samples. (G) The common and specific genus was shown by the Venn diagram between WT and Atg16L1T300A/T300A mouse ileal mucosa. (H) Relative abundance of Akkermansia, norank_f_Ruminococcaceae, and Tyzzerella genus in WT and Atg16L1T300A/T300A mouse ileum mucosa scraping samples. Each dot represents an individual mouse sample. (I) Histogram of LDA value distribution identified by LEfSe analysis of ileum mucosa scraping samples. The relative bacterial abundance was calculated by normalizing each WT and T300A mouse bacterial abundance with the mean value of bacterial abundance of all WT mice. *p < 0.05, **p < 0.01 (non-parametric test followed by a Mann–Whitney test).

