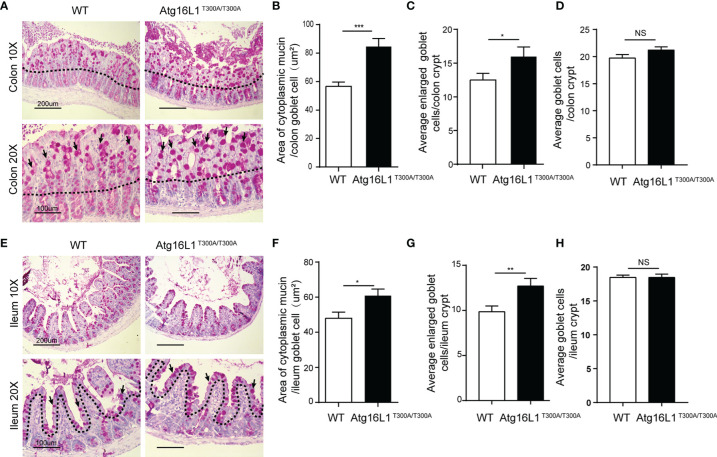
Figure 3.
Atg16L1T300A/T300A mice display morphological abnormalities in their Goblet cells. (A) PAS-stained colonic sections of cohoused WT and Atg16L1T300A/T300A mice. Hematoxylin is in blue. Black dotted lines outline the surface epithelium. Arrows indicate surface goblet cells (scale bars: down, 100 μm and upper, 200 μm). (B) Quantification of average mucin area/colon goblet cells, and (C) average number of enlarged goblet cells in the upper crypt region of cohoused WT and Atg16L1T300A/T300A mouse colon. (D) Quantification of the total number of goblet cells per crypt in the colon of WT and Atg16L1T300A/T300A mice (n = 6–8 mice/group from 3 independent experiments; 50 goblet cells measured/mouse). This analysis was performed on upper crypt goblet cells [above the upper dashed line in (A)]. (E) PAS-stained ileum sections of cohoused WT and Atg16L1T300A/T300A mice. Hematoxylin is in blue. Black dotted lines outline the surface epithelium. Arrows indicate surface goblet cells (scale bars: down, 100 μm and upper, 200 μm). (F) Quantification of the average area of cytoplasmic mucin/ileum goblet cells in the upper crypt region of WT and Atg16L1T300A/T300A mouse ileum. (G) Quantification of the average number of enlarged goblet cells in the upper crypt region and (H) the average total number of goblet cells per crypt in the ileum of WT and Atg16L1T300A/T300A mice (n = 6–8 mice/group from 3 independent experiments; 50 goblet cells measured/mouse). This analysis was performed on upper crypt goblet cells [above the upper dashed line in (F)]. Data are expressed as mean and s.e.m. *p < 0.05, **p < 0.01, ***p < 0.001, NS, not significant (non-parametric test followed by a Mann–Whitney test).

