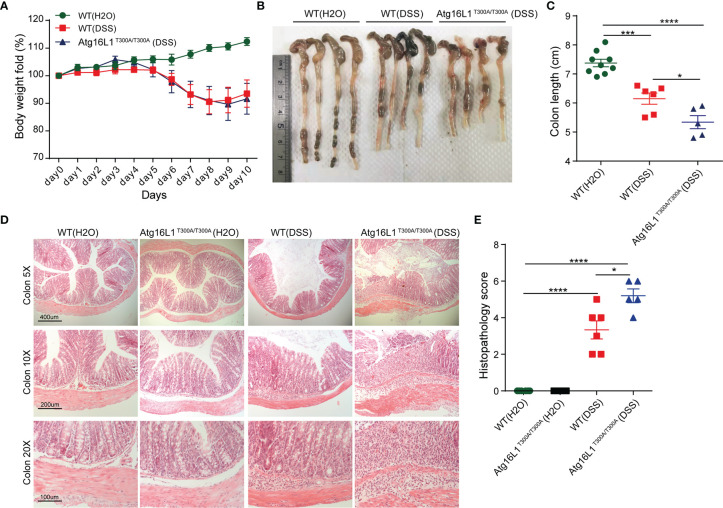
Figure 5.
Atg16L1T300A/T300A mice exhibit more severe inflammation in DSS-induced colitis. (A) Weight loss of WT mice with drinking water (n = 9, 3 male and 6 female) and cohoused WT (n = 6, 2 male and 4 female) and Atg16L1T300A/T300A mice (n = 5, 1 male and 4 female) treated with 1.5% DSS for 7 days followed by 3 days of regular drinking water. (B, C) Gross pathology of colons on day 10 post 1.5% DSS. (D) Representative H&E staining of distal colon sections obtained from cohoused WT and Atg16L1T300A/T300A mice with drinking water and cohoused WT and Atg16L1T300A/T300A mice on day 10 post DSS treatment (scale bar, represents 400 μm; images acquired at 5×; represents 200 μm; images acquired at 10×; represents 100 μm; images acquired at 20×). (E) Histological analysis of distal colon harvested at day 10 post-DSS provided by a pathologist blinded to the groups and the study. Results representative of at least 3 independently performed experiments and displayed as mean ± SEM. *p < 0.05; ***p < 0.001; ****p < 0.0001 (non-parametric test followed by a Mann–Whitney test; one/two-way ANOVA analysis followed by a Tukey/Bonferroni post hoc test for three group analysis).

