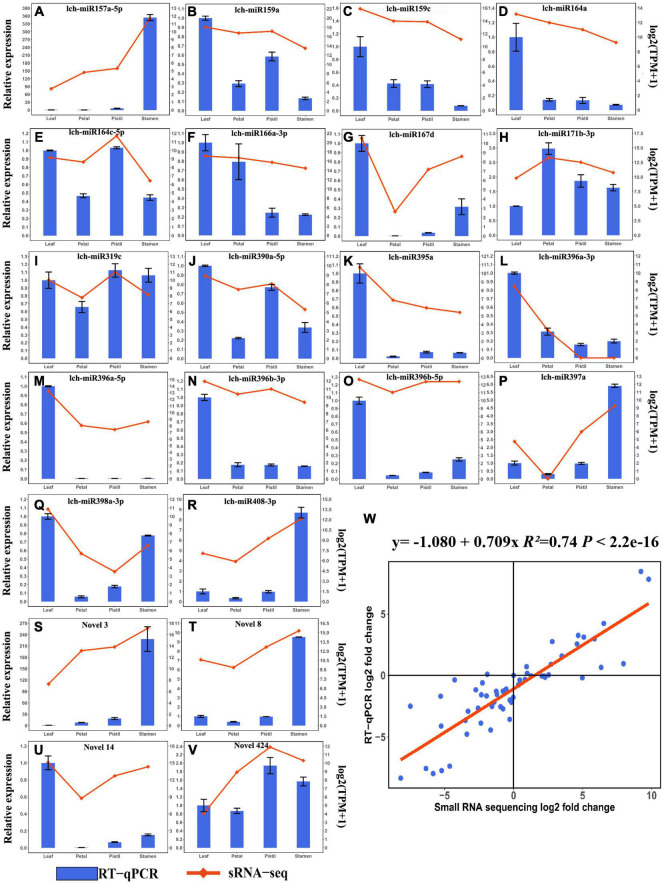
FIGURE 4.
RT-qPCR validation of DEMs. (A–V) Relative expression analysis and expression levels detected by small RNA sequencing of lch-miR157a-5p, lch-miR159a, lch-miR159c, lch-miR164a, lch-miR164c-5p, lch-miR166a-3p, lch-miR167d, lch-miR171b-3p, lch-miR319c, lch-miR390a-5p, lch-miR395a, lch-miR396a-3p, lch-miR396a-5p, lch-miR396b-3p, lch-miR396b-5p, lch-miR397a, lch-miR398a-3p, lch-miR408-3p, Novel3, Novel8, Novel14, and Novel424, respectively. The relative expression levels and expression levels detected by small RNA sequencing of miRNAs are presented as a bar plot and line plot, respectively. (W) Correlation analysis between the relative expression analysis and small RNA sequencing results of 22 DEMs.

