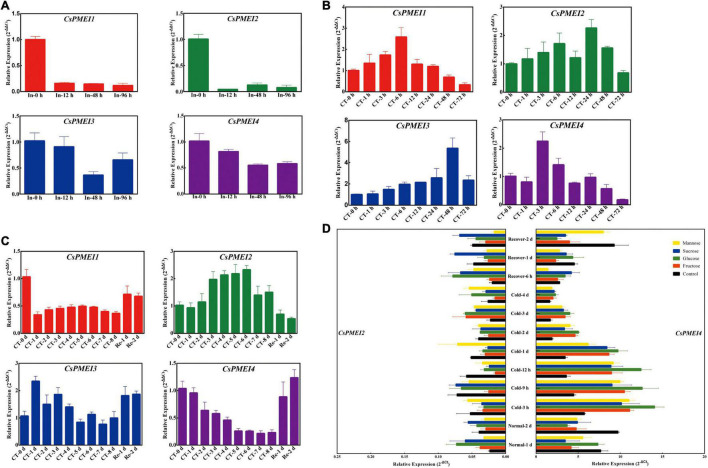
FIGURE 3.
Temporal-spatial expression patterns of CsPMEIs in response to biotic, cold and various sguar treatments. (A) Expression profiles of CsPMEIs under C. fructicola infection condition. Samples at 0 h were used as control, and the final results were calculated with 2– Δ Δ Ct method. ‘In’ represents infection treatment. Data are shown as the means ± SE (n = 3). (B) Expression profiles of CsPMEIs at one bud and one leaf stage of tea plant under cold condition. Samples at 0 h were used as control, and the final results were calculated with 2– Δ Δ Ct method. ‘CT’ represents cold treatment. Data are shown as the means ± SE (n = 3). (C) Expression profiles of CsPMEIs at one bud and three leaves stage of tea plant under cold condition. Samples at 0 h were used as control, and the final results were calculated with 2– Δ Δ Ct method. ‘CT’ represents cold treatment. Data are shown as the means ± SE (n = 3).(D) Expression analysis of CsPMEIs in tea plant leaves under different sugar and temperature conditions. All results were calculated by using the 2– Δ Ct method. Data are shown as the means ± SE (n = 3).

