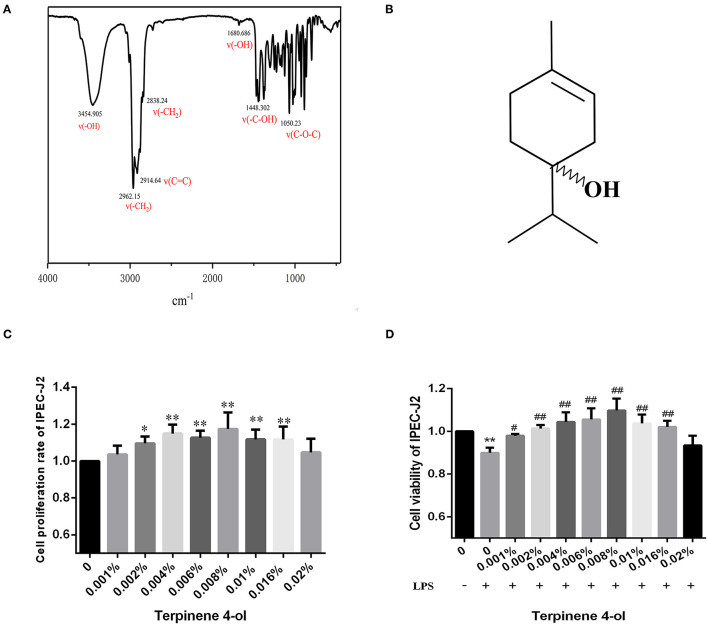
Figure 2.
The characterization of TER. (A) The infrared spectrum of TER. (B) The chemical structure of TER intestinal epithelial cells pretreated with different TER concentrations for 24 h followed by treatment with LPS (10 μg/mL) for 24 h. The effects of TER on (B,C) cytotoxicity and (D) cell viability were observed in IPEC-J2 cells exposed to LPS. The data are expressed as the mean ± standard error of three independent experiments. * P < 0.05, ** P < 0.01, compared with the blank control group. # P < 0.05, ## P < 0.01, compared with the blank LPS group.

