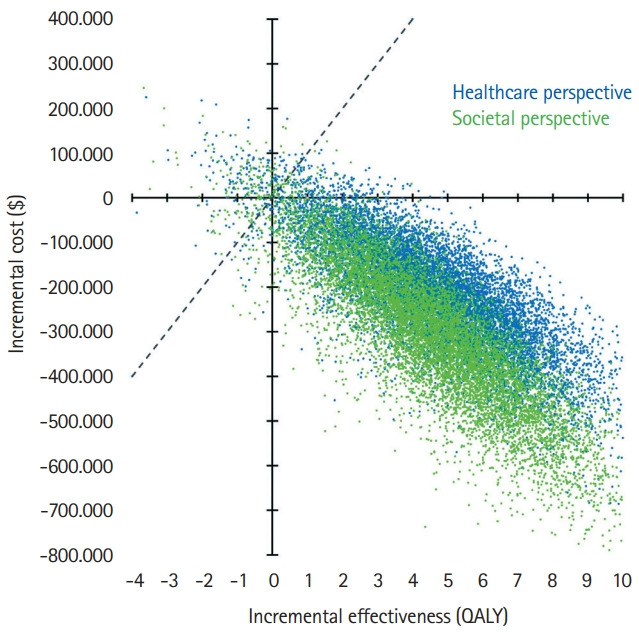
Figure 3.

Probabilistic sensitivity analysis from the healthcare and societal perspective. Cost-effectiveness planes of incremental costs and incremental effectiveness of endovascular thrombectomy (EVT) versus standard care are shown for the probabilistic sensitivity analysis. Each dot represents one simulation run. The dashed line indicates a willingness-to-pay threshold of $100,000/quality-adjusted life year (QALY). Dots right to this line are considered cost-effective simulation runs. Dots in the right lower quadrant indicate cost-savings combined with incremental QALYs by EVT.
