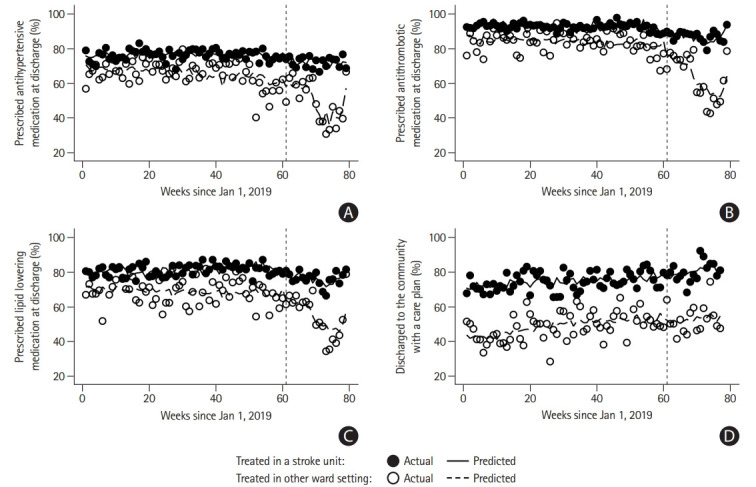
Figure 2.

Proportion of patients prescribed secondary prevention medications (A: antihypertensive medication; B: antithrombotic medication; C: lipid lowering medication) at discharge and (D) discharged to the community with a care plan. The vertical line (week 61) indicates the week of the interruption used in this study (1/3/2020, the first coronavirus disease 2019 [COVID-19] related death in Australia). Significant difference in weekly trend between groups prior to interruption (β and 95% confidence intervals [CIs] presented): discharged to the community with a care plan –0.09 (95% CI, –0.17 to –0.01). Significant difference during week of interruption between groups (week 61): discharged to the community with a care plan 3.61 (95% CI, 0.28 to 6.94). Significant difference in weekly trend between groups in post-interruption period: provided antihypertensive medication at discharge 0.58 (95% CI, 0.08 to 1.07); provided antithrombotic medication at discharge 1.08 (95% CI, 0.78 to 1.38); provided lipid lowering medication at discharge 0.69 (95% CI, 0.28 to 1.09). β in a period signifies the the difference in the average weekly percentage change over several weeks (trend) between groups. β during the week of the interruption signifies the difference in a percentage change during that week between groups. Positive values indicate a greater relative percentage increase in the provision of evidence-based care in stroke units compared with other ward settings. Negative values indicate a greater relative percentage decrease in the provision of evidence-based care in stroke units compared with other ward settings. Other point estimates relevant to the figure are provided in the Supplementary Table 2.
