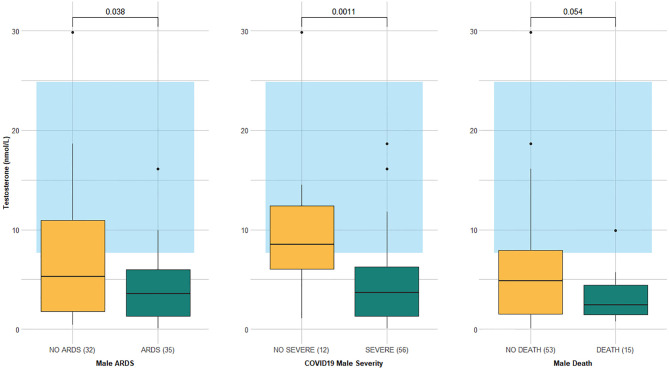
Figure 2.
Testosterone levels according to outcomes (ARDS, severe COVID-19, and in-hospital mortality) in 68 males aged 50 years and older. Data are expressed as box plot with median (cross line) and interquartile ranges; whiskers are the minimum and maximum values. The laboratory-assessed hormone reference ranges are indicated in light blue. Circles represent the outliers.

