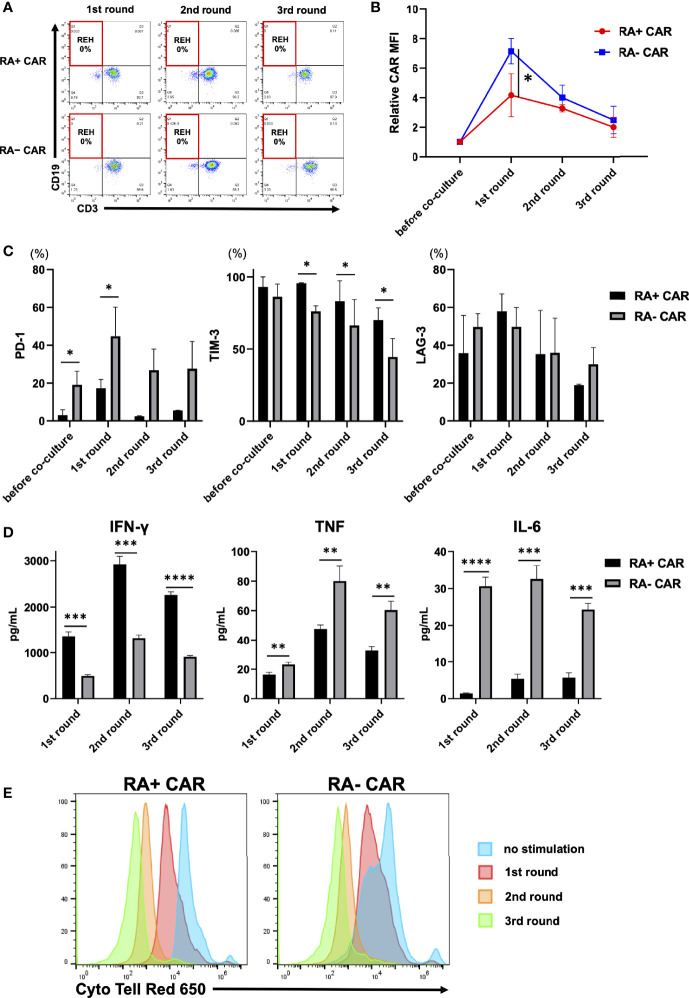
Figure 2.
Analysis of chimeric antigen receptor (CAR) function by in-vitro serial tumor challenge assay. (A) The expression of CAR-T and REH cells during sequential co-culture. Representative dot plots are shown. (B) Relative CAR mean fluorescence intensity (MFI) (MFI = 1, before co-culture) of CAR-T cells during sequential co-culture (n = 3). CAR MFI of CAR-T cells were calculated after gating on the CAR positive population. (C) The expression of PD-1, TIM-3, and LAG-3 on CAR-T cells during sequential co-culture (n = 3). (D) The level of cytokines in the co-culture supernatant containing CAR-T cells with REH cells after sequential co-culture (n = 3). (E) Cell division of CAR-T cells upon repeated REH cells stimulations or no stimulation. All data are presented as means ± standard deviation. *P < 0.05, ***P < 0.01, ***P < 0.001, ****P < 0.0001. PD-1, programmed cell death protein-1; TIM-3, T cell immunoglobulin mucin-3.

