
Figure 6.
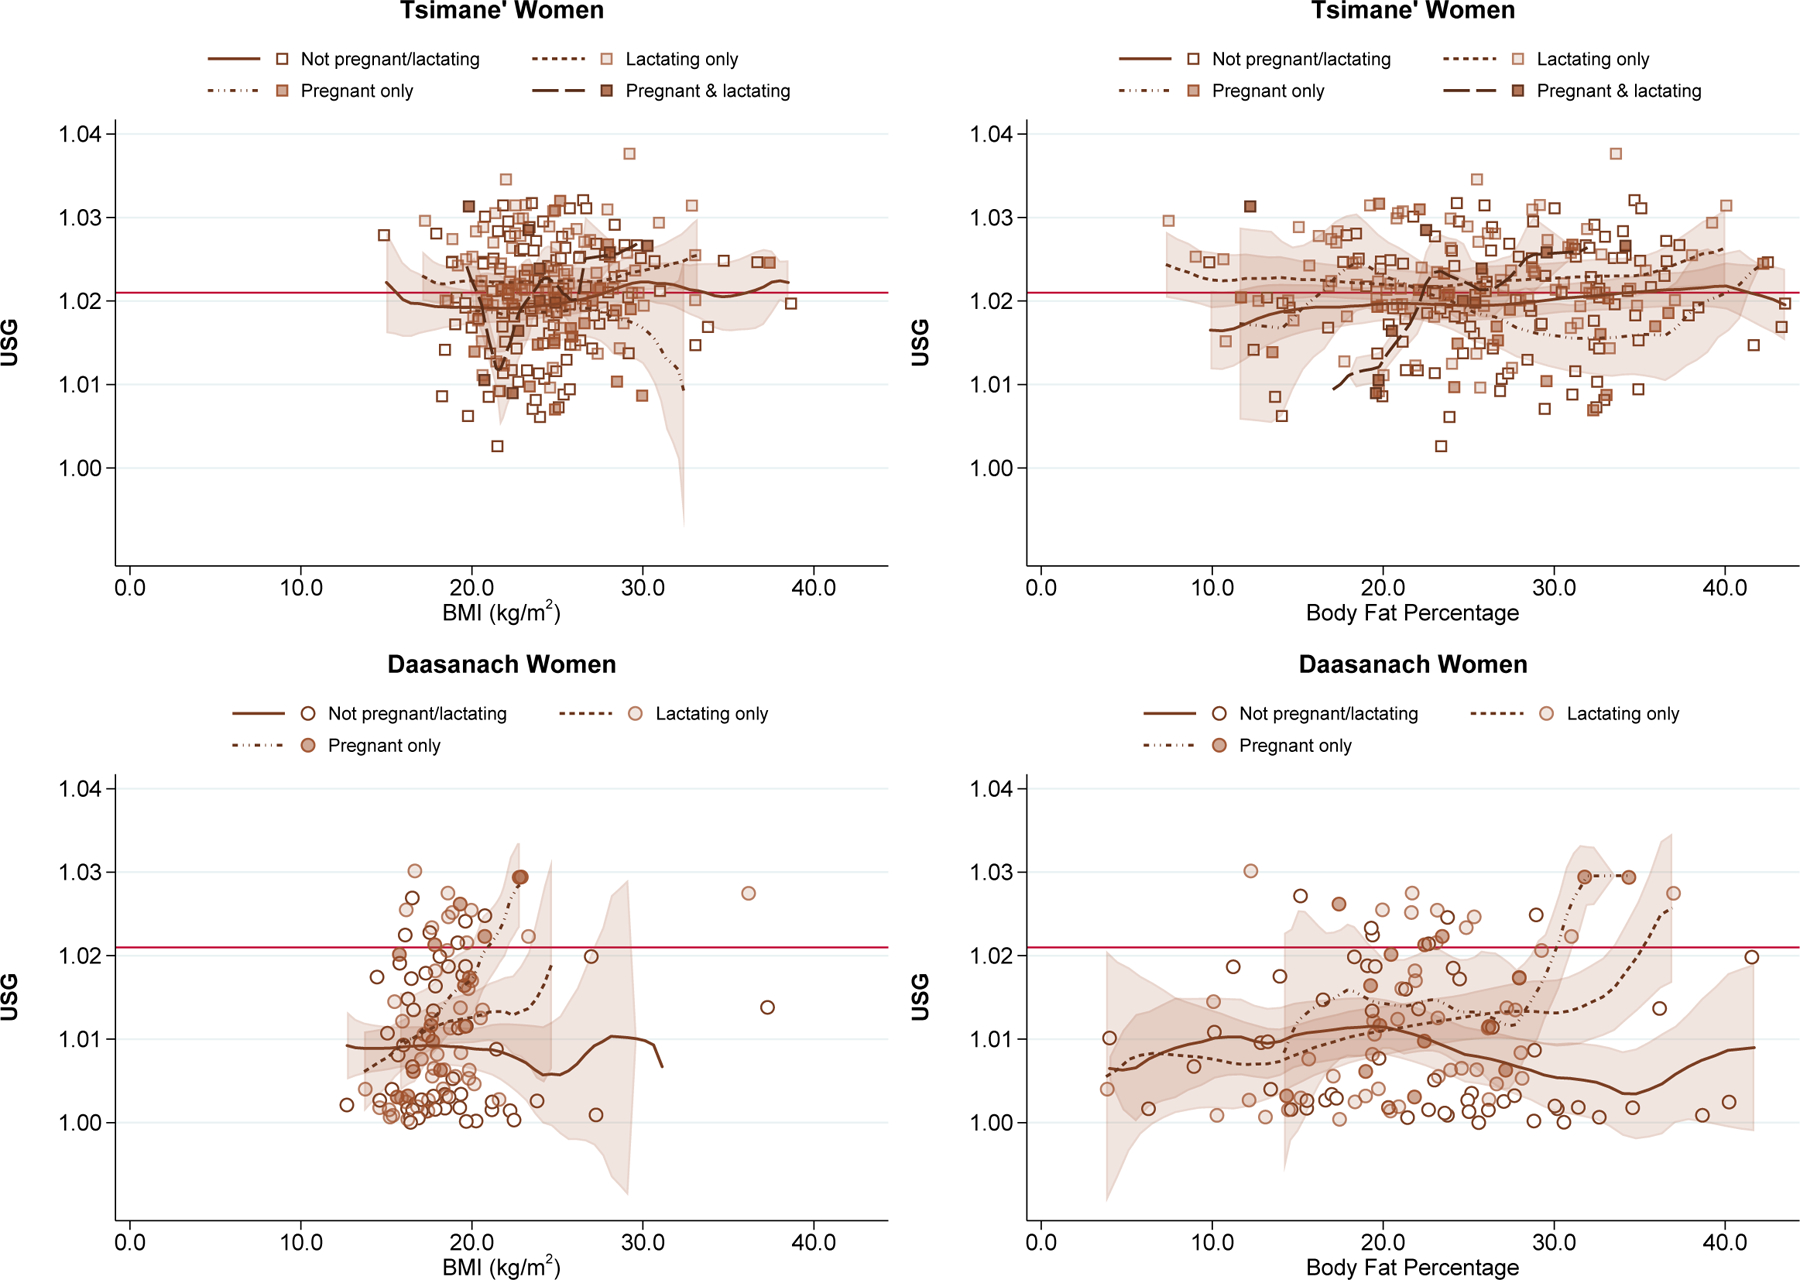
Urine Specific Gravity by Body Mass Index and Body Fat Percentage among Women Classified by Reproductive Status
Note: Local polynomial smooth plots with CIs
Figure for body fat percentage among Tsimane’ women is excluding 2 outliers with values >55%.