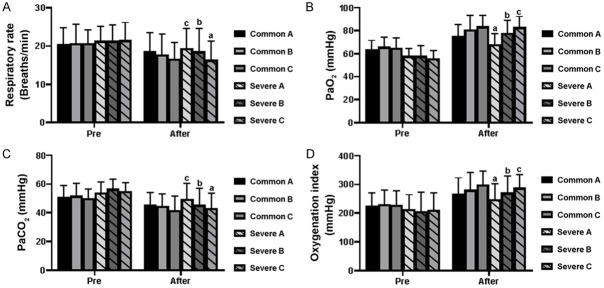
Figure 5.
Changes in (A) respiratory rate, (B) PaO2, (C) PaCO2, and (D) oxygenation index of the patients after the treatment. Bars in each column represent the standard deviation. Different letters (a, b and c) above the bar indicate a difference among severely affected patients (P<0.05) after the treatments. Comparison was carried out by the LSD test.

