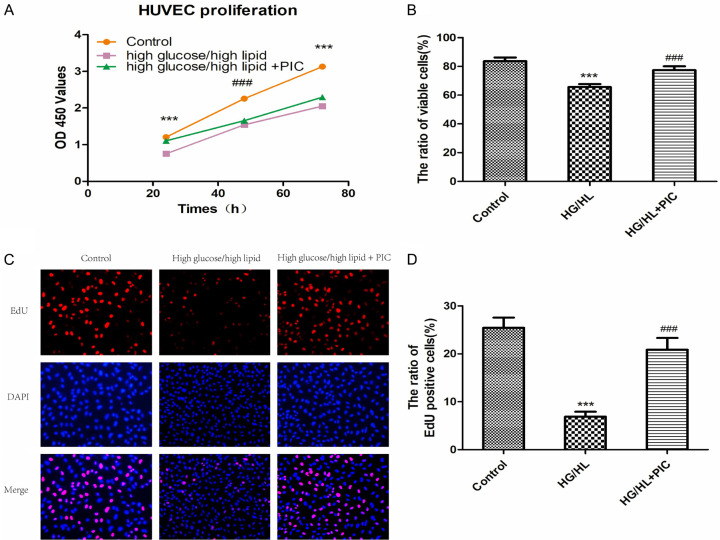
Figure 5.
PIC attenuated the HG/HL-induced decrease in HUVEC proliferation. A. Cell proliferation of HUVECs treated with d-glucose (33 mM)/palmitic acid (200 μM) for 72 hours alone or in combination with 10 μM PIC for 24 hours based on CCK-8 assay. B. HUVEC cell viability under different conditions based on trypan blue exclusion assay. C. Cell proliferation based on active DNA synthesis using the EdU incorporation assay. D. Ratio of EdUration based on active DNA synthesis using the E Values are expressed as means ± SD. ***P < 0.05, vs. control group; ###P < 0.05, vs. HG/HL treatment group. Scale bar: 200 μm for 4×.

