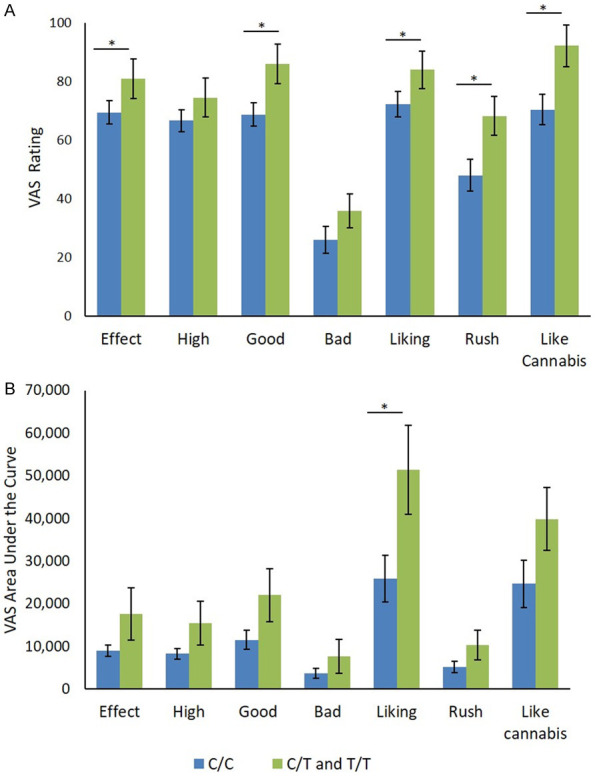
Figure 1.

Effects of rs510769 genotype on subjective responses to cannabis measured by visual analog scales. Data expressed as mean ± SEM of (A) maximum VAS ratings by rs510769 genotype (C/C: N = 38; C/T and T/T: N = 13) and (B) area under the curve of VAS ratings over time (C/C: N = 34; C/T and T/T: N = 11). C/C genotype compared to C/T and T/T genotypes using independent sample t-tests. *P<0.05.
