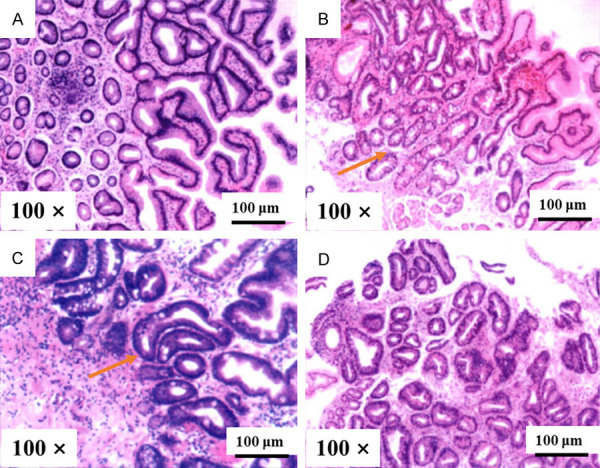
Figure 5.

Typical pathological pictures of the gastric mucosa (HE stain, Magnified ×100). Note: (A) Indicated a pathological picture of the experimental group before treatment, while (B) Indicated a pathological picture of the experimental group after treatment. (C) Indicated a pathological picture of the control group before treatment, while (D) Indicated a pathological picture of the control group after treatment. The red arrows indicated markedly reduced glands.
