
Figure 1.
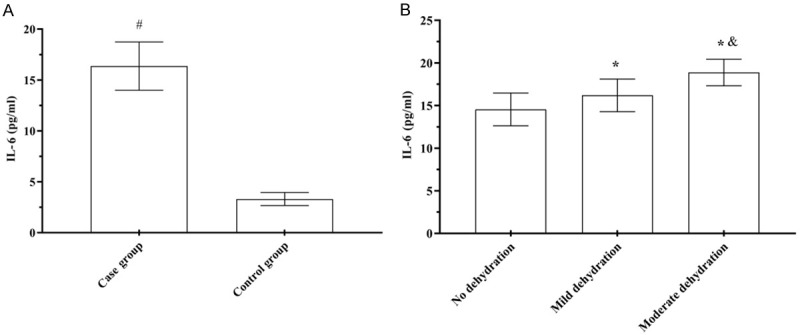
Comparison of serum IL-6 levels. A: Serum IL-6 levels; B: Serum IL-6 levels. Compared to the control group, #P<0.05; compared to children without dehydration, *P<0.05; compared to children with mild dehydration, &P<0.05.
Official websites use .gov
A
.gov website belongs to an official
government organization in the United States.
Secure .gov websites use HTTPS
A lock (
) or https:// means you've safely
connected to the .gov website. Share sensitive
information only on official, secure websites.
Comparison of serum IL-6 levels. A: Serum IL-6 levels; B: Serum IL-6 levels. Compared to the control group, #P<0.05; compared to children without dehydration, *P<0.05; compared to children with mild dehydration, &P<0.05.