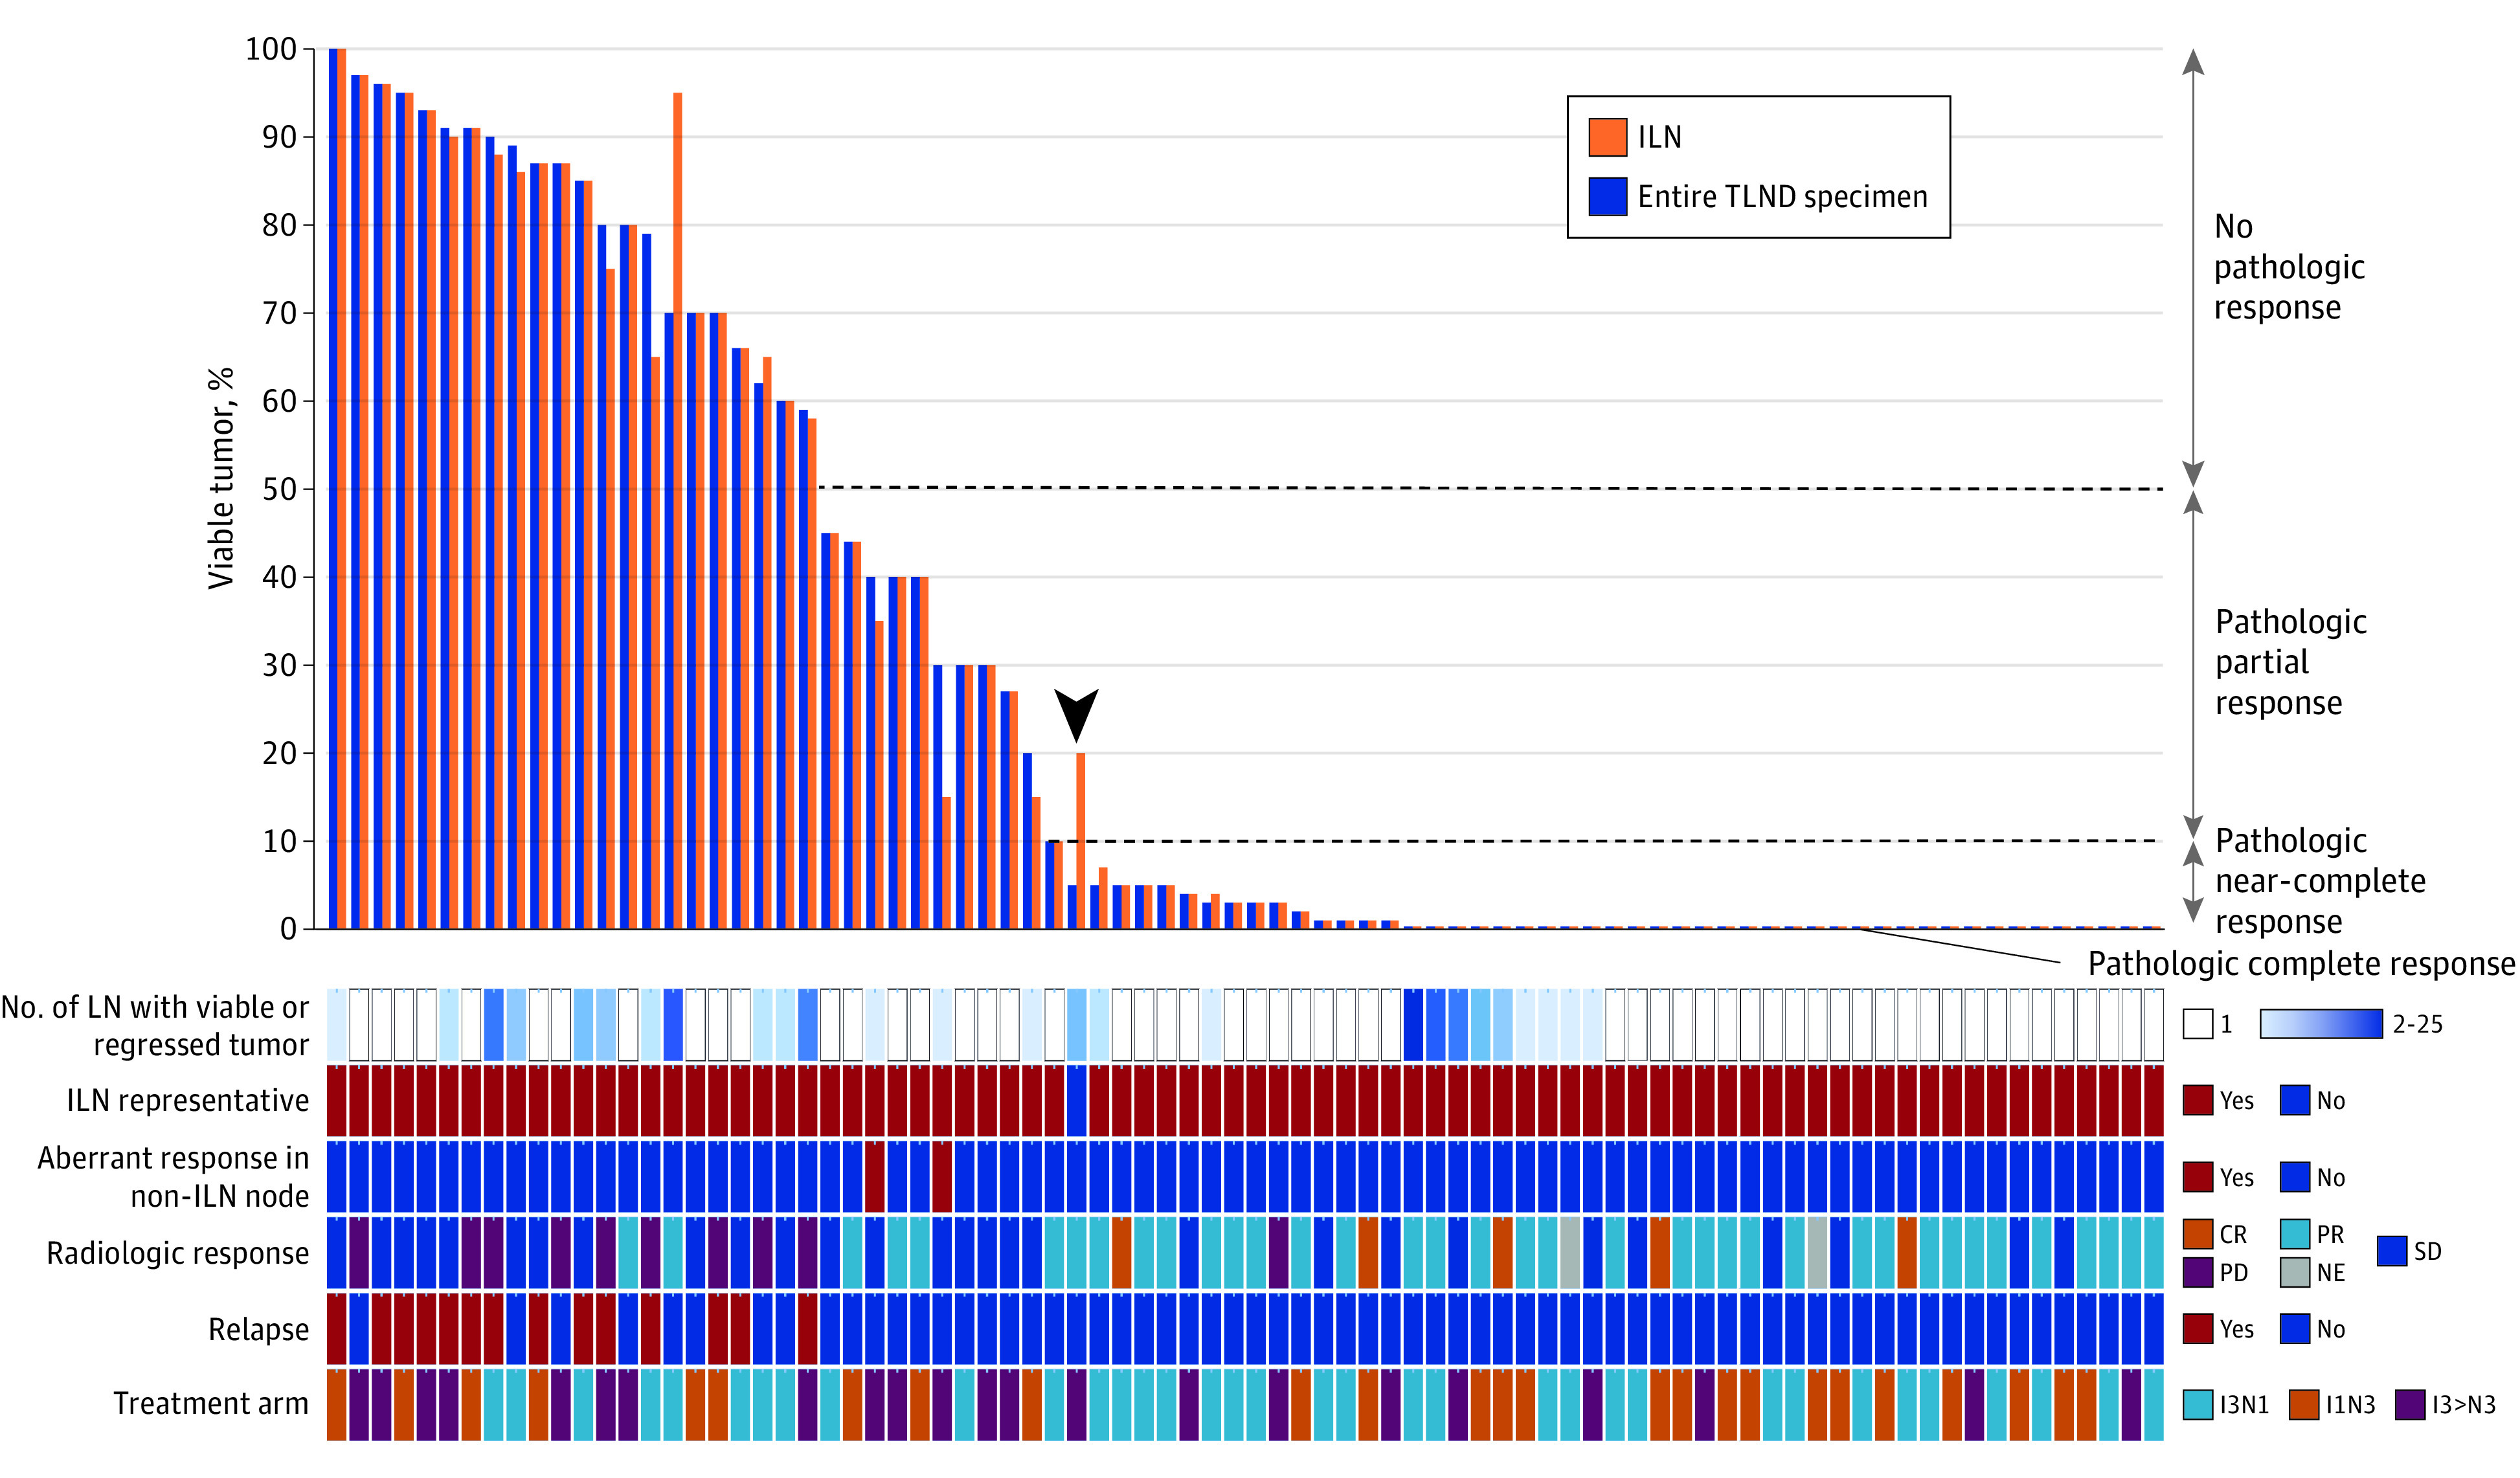
Figure 2. Concordance of the Pathologic Response in ILN With Pathologic Response in Entire Lymph Node Bed.

Waterfall plot of concordance of the pathologic response in the ILN with the pathologic response of the entire lymph node bed in each patient (column). The arrowhead denotes the 1 patient with discordant responses. CR indicates complete response; ILN, index lymph node; IxNx, ipilimumab x mg/kg plus nivolumab x mg/kg; NE, not evaluable; PD, progressive disease; PR, partial response; SD, stable disease; TLND, therapeutic lymph node dissection.
