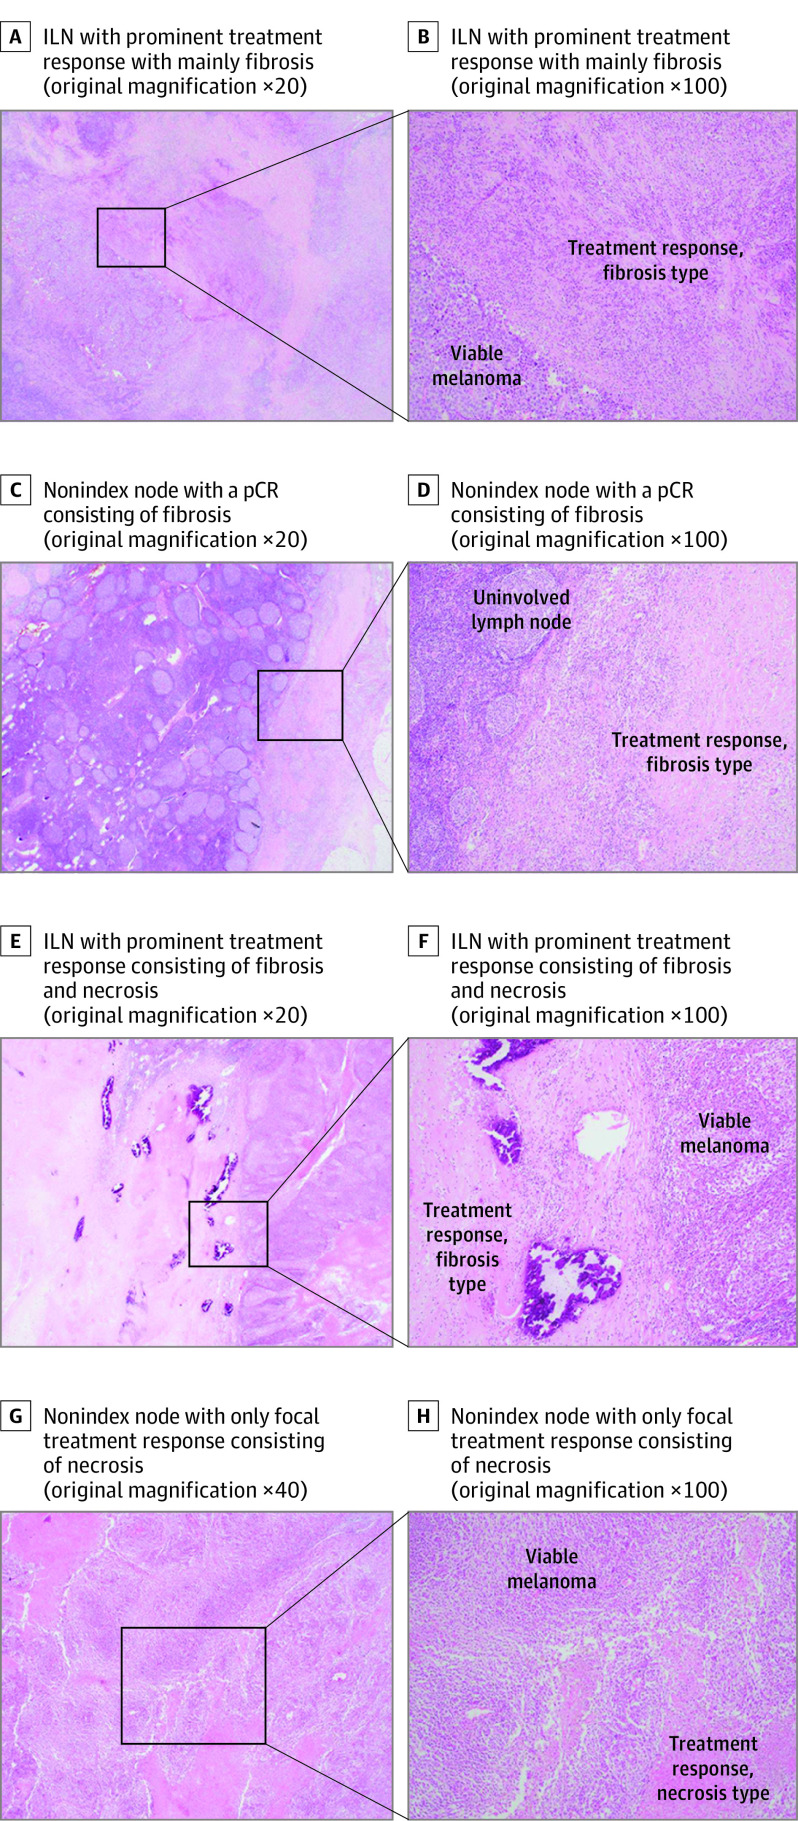
Figure 3. Discordant Pathologic Response in the Index Lymph Node (ILN) vs Nonindex Node After Neoadjuvant Immunotherapy for Stage III Melanoma.
A-D, Hematoxylin-eosin (H&E)–stained images of the patient with discordant responses in the ILN (20% viable tumor; pathologic partial response [pPR]) vs total lymph node tumor bed (5% viable tumor; near pathologic complete response [near-pCR]). A and B, ILN with prominent treatment response with mainly fibrosis. C and D, Nonindex node with a pCR consisting of fibrosis. E-H, H&E images of a patient with 1 small node with aberrant response (80% viable tumor; pathologic nonresponse [pNR]) whereas the ILN and total lymph node tumor bed showed a pPR. E-F, ILN with prominent treatment response consisting of fibrosis and necrosis. G-H, Nonindex node with only focal treatment response consisting of necrosis.

