
Figure 3. Association of Exacerbated COVID-19 Impact With Family Structure.
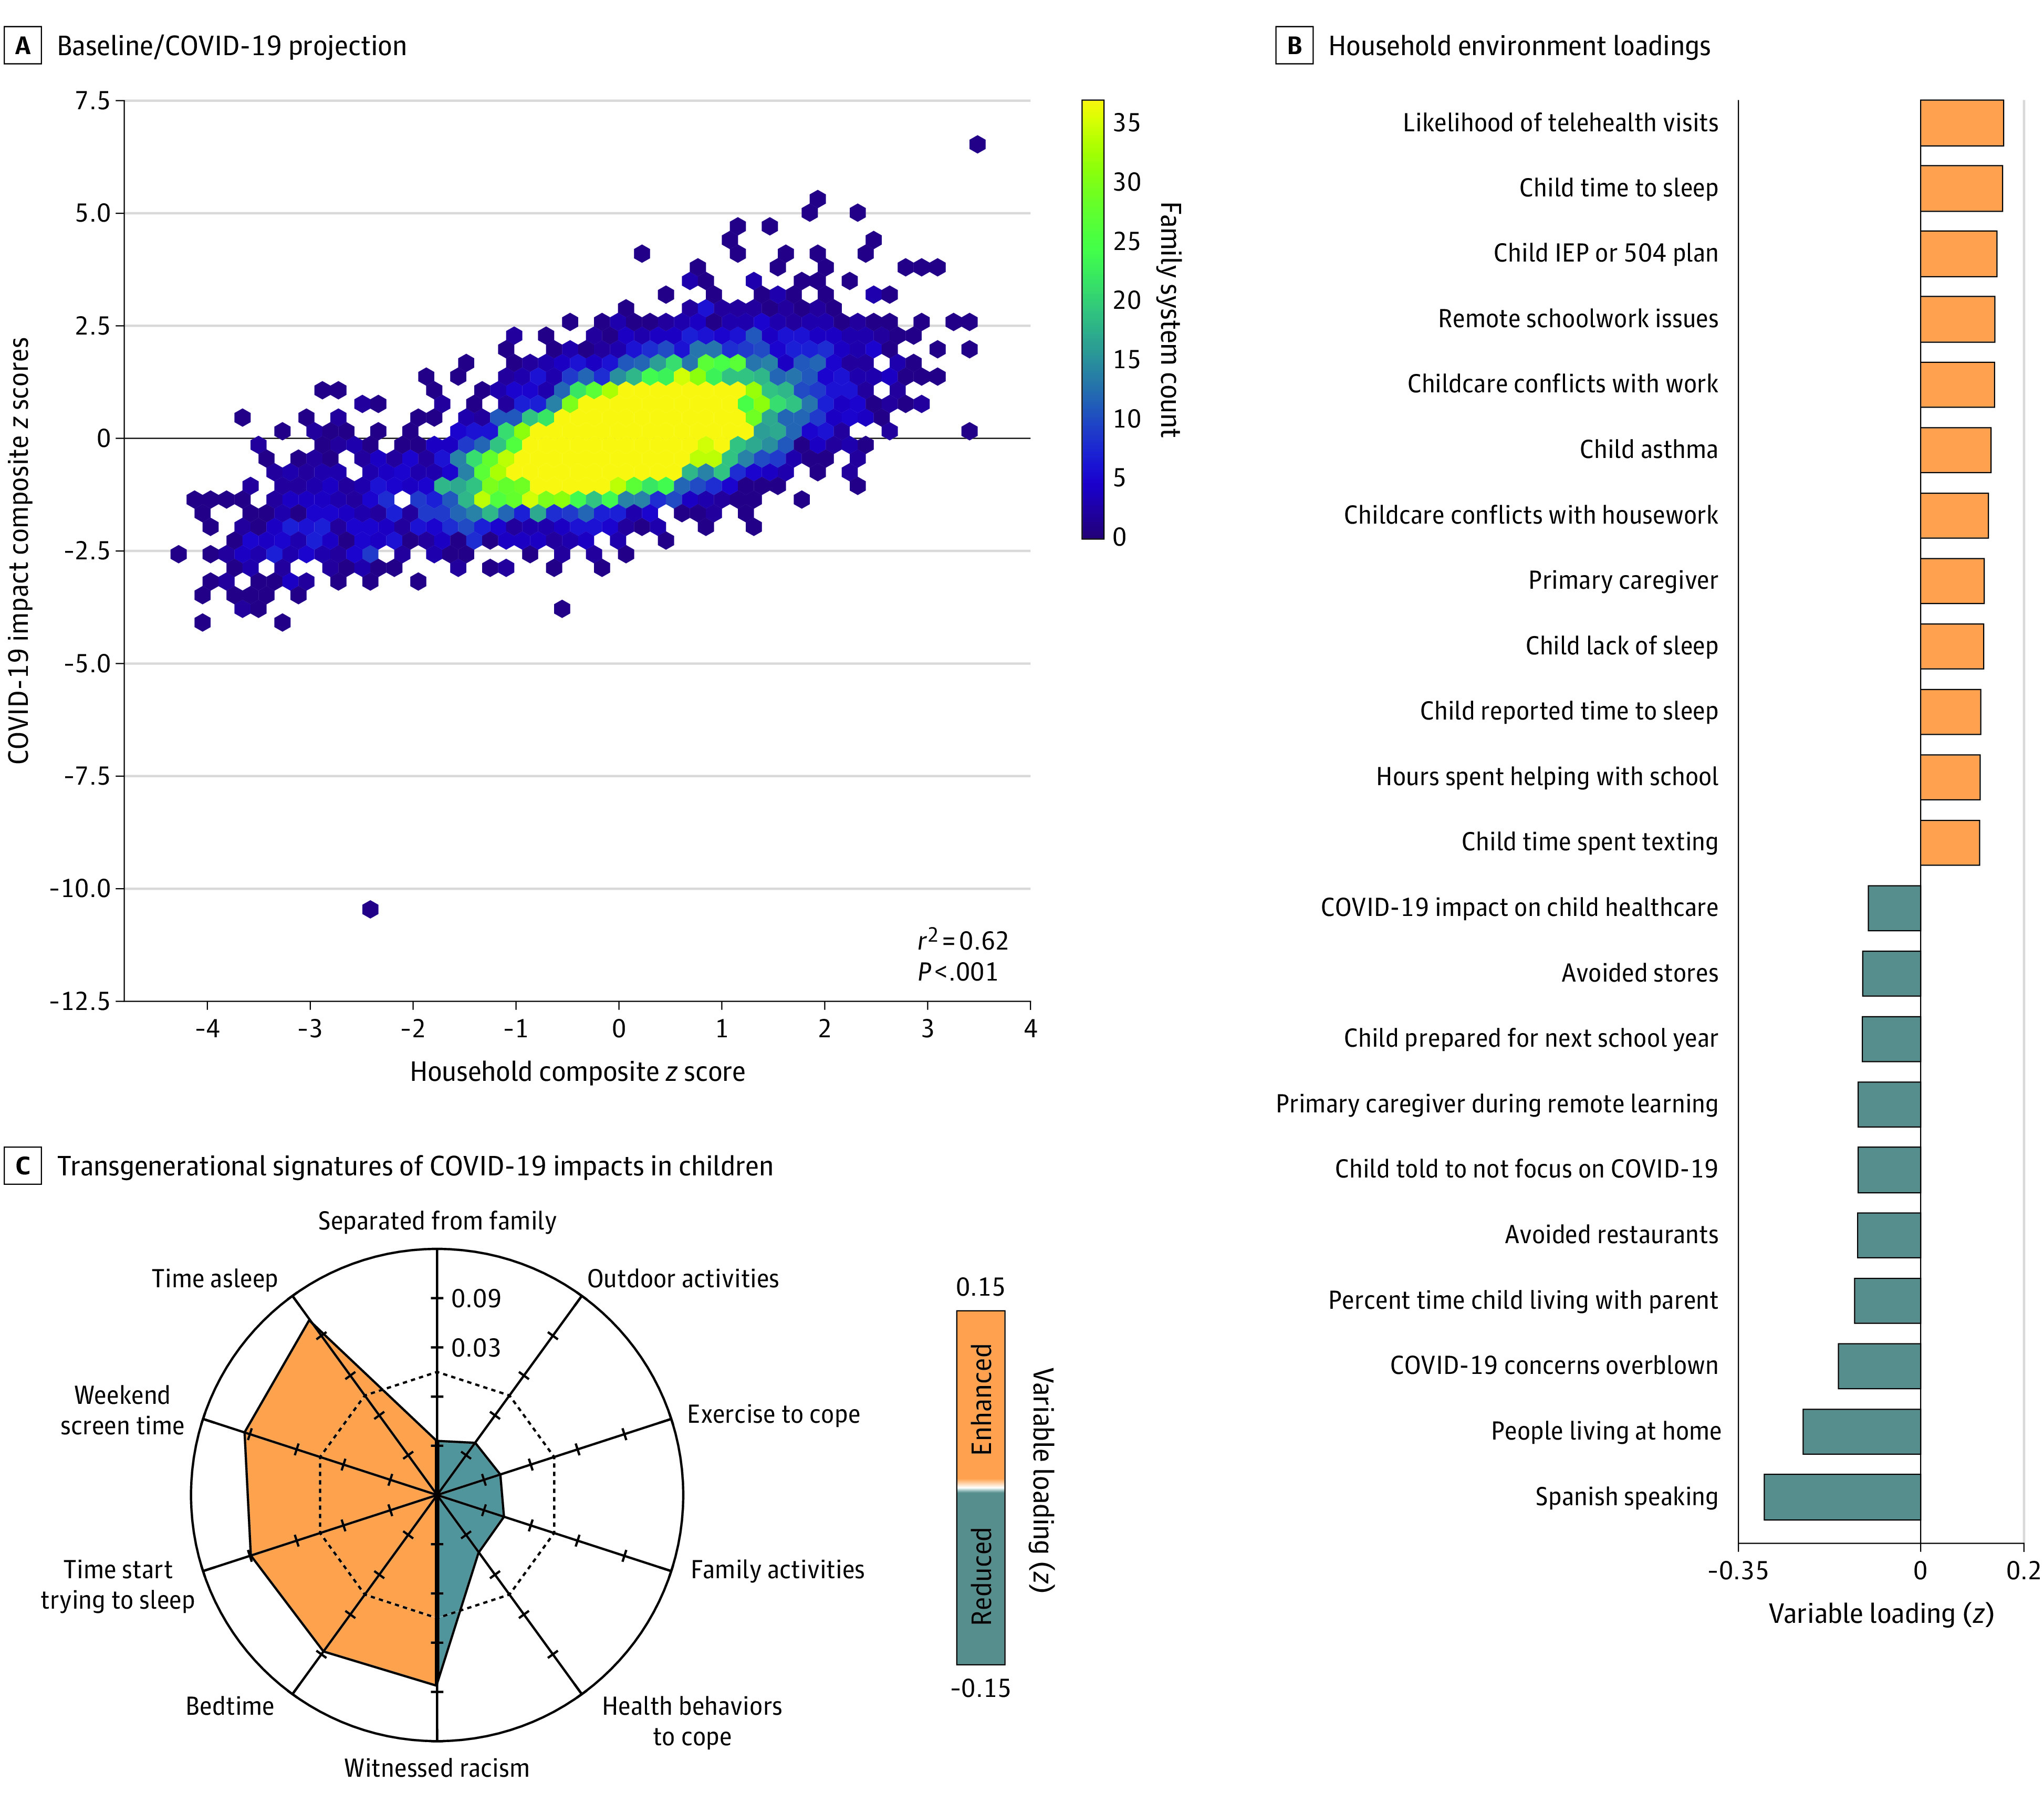
A, Across individual families, household environment was positively associated with COVID-19 impact composite scores of the secondary mode. Modeling results are displayed in a hexagonal binning plot: scale bar reflects the number of families with the same baseline COVID-19 association. B, The bar plot reflects household environment variable loadings from mode 2 indicating a strong positive association with family structure, childcare needs, and child medical and school support needs. The bar plot reflects the top-ranked household characteristics in families with high mode 2 expression (orange indicates positive associations; blue, negative associations). C, The radial plot summarizes experienced racism, sleep hygiene, and social media consumption associated with mode 2. For complete variable definitions, see eTables 2 and 3 in the Supplement. IEP indicates individualized education program.