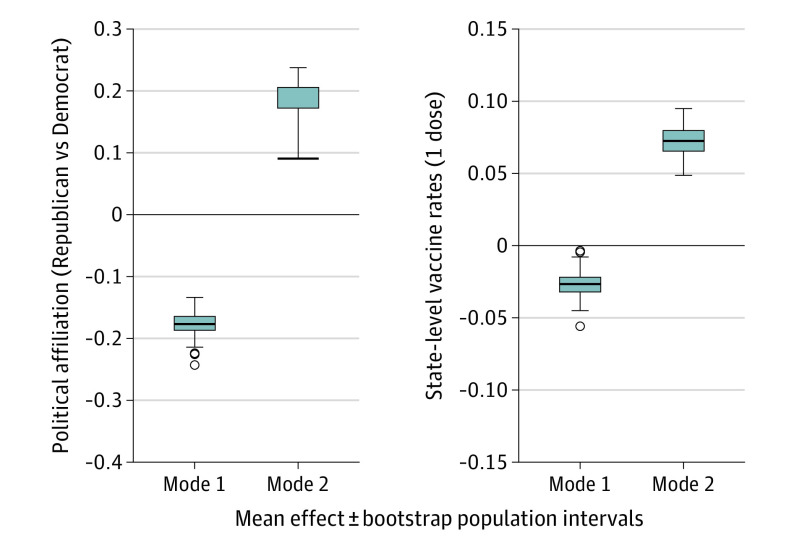
Figure 5. Out-of-Sample Pattern Prediction of Preferred News Media Outlet, Political Affiliation, and Vaccine Rollout During COVID-19.
Both modes 1 and 2 can be used to predict the political affiliation and pace of vaccine rollout for a given geographic region. Political affiliations were defined based on the results of the 2020 US presidential election. Vaccine rates are defined as the percentage of individuals having received at least 1 vaccine dose as of May 2021, based on US Centers for Disease Control and Prevention data (eMethods in the Supplement). For each box plot, family data from approximately two-thirds of random family picks were used to train linear predictive models (details in Methods), which were then evaluated for prediction accuracy in approximately one-third of unseen holdout families (dispersion and whiskers). Box plots show the corresponding effect sizes, while the error bars show the robustness of the effect sizes.

