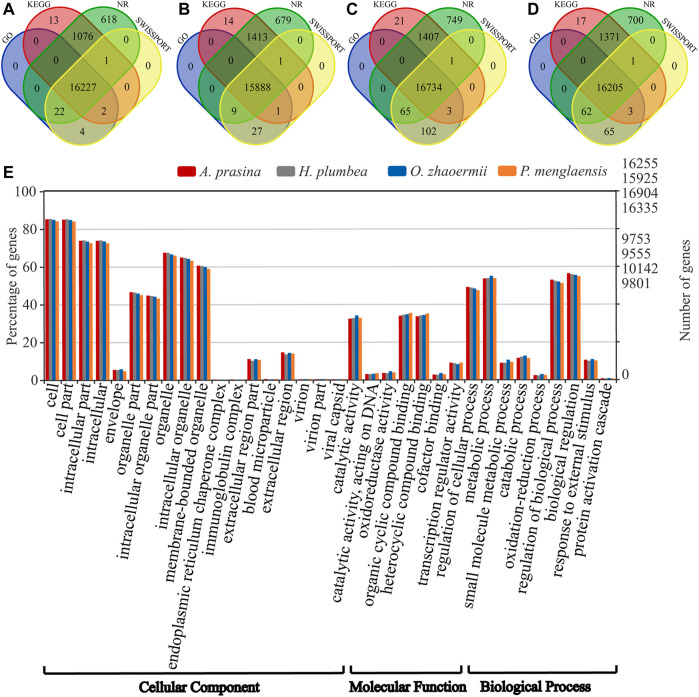
FIGURE 2.
Overview of annotative summary of de novo transcriptome assembly. (A–D) Venn diagram showing the number of specific and overlapping annotated unigenes between annotated results from four public databases. (A) Functional annotation of transcripts in of A. prasina. (B) Functional annotation of transcripts of H. plumbea. (C) Functional annotation of transcripts of O. zhaoermii. (D) Functional annotation of transcripts of P. menglaensis. (E) Comparison of Gene Ontology (GO) classifications based on de novo transcriptome assembly of four species of snakes.

