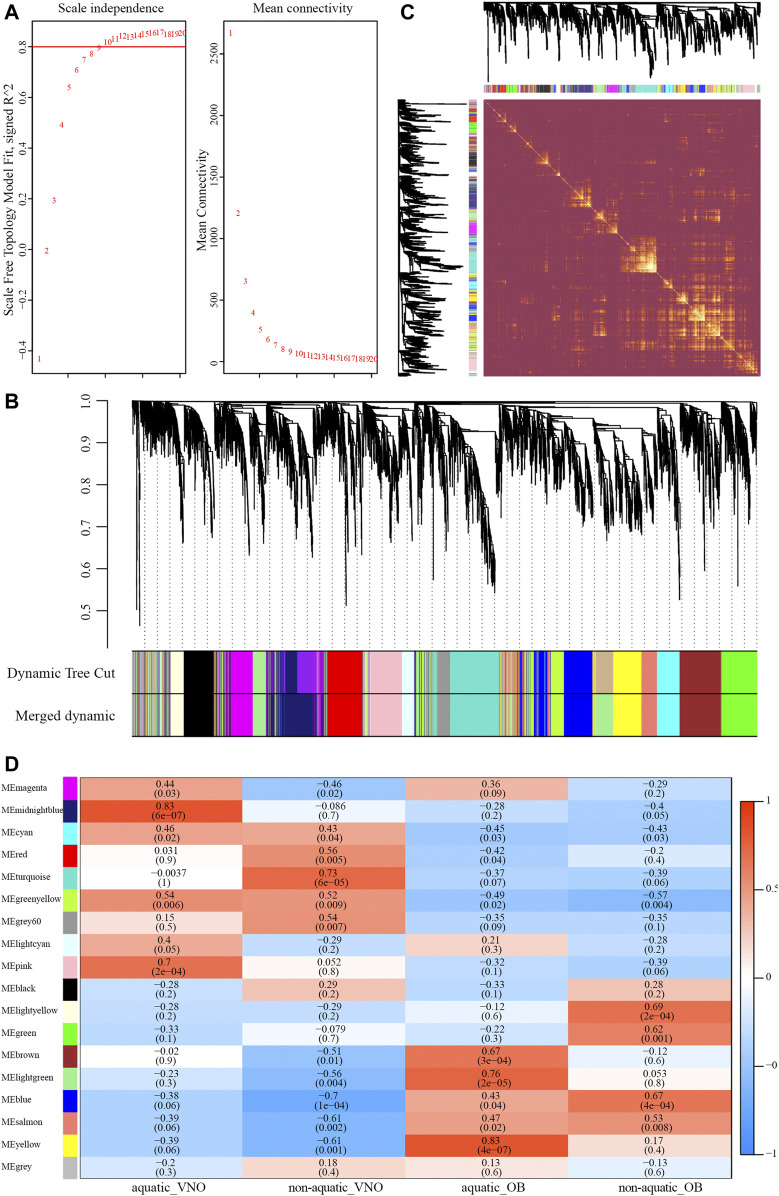
FIGURE 4.
Construction of the weighted gene co-expression network (WGCNA). (A) Analysis of soft-thresholding powers based on scale independence (left) and mean connectivity (right). (B) The cluster dendrogram of orthologous genes. Each row corresponds to a module eigengene. (C) Network heatmap plot of orthologous genes. (D) Module-traits relationships identified by WGCNA. The color and the number (above) of each cell indicate the correlation and the numbers in parentheses represent p-value.

