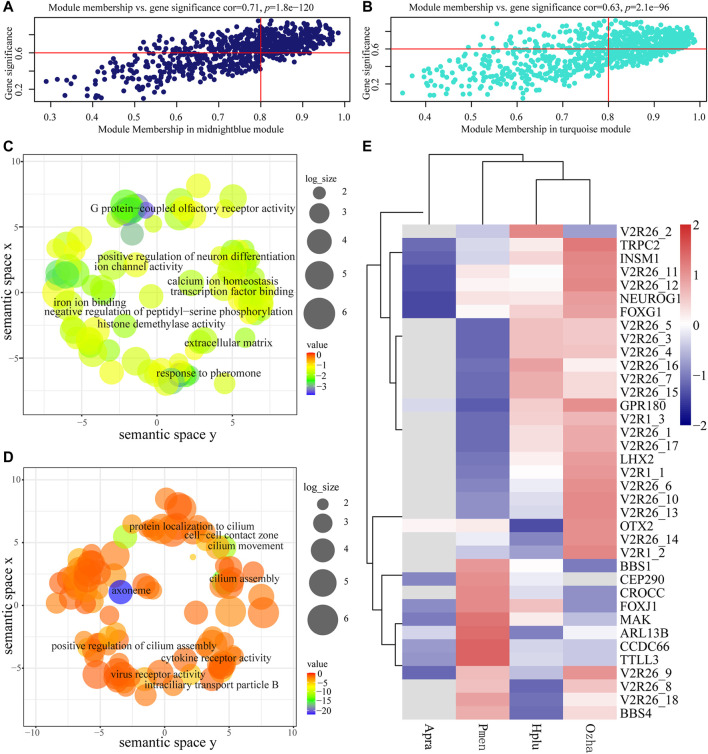
FIGURE 6.
Analysis of the aquatic AOS (midnight-blue) module and the non-aquatic AOS (turquoise) module. (A) Scatterplots of gene significance (GS) for habitat traits versus module membership (MM) in the aquatic AOS module. (B) Scatterplots of gene significance (GS) for habitat traits versus module membership (MM) in the non-aquatic AOS module. (C) GO enrichment analysis of genes in the aquatic AOS module was visualized using REVIGO. (D) GO enrichment analysis of genes in the non-aquatic AOS module was visualized using REVIGO. (E) The expression of olfactory-related genes in the two modules.

