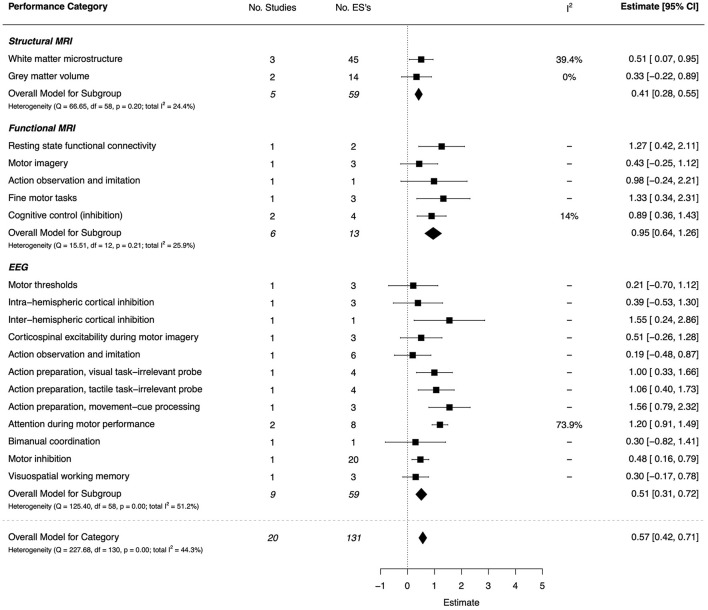
Figure 15.
Forest plot showing the meta-analysis results for the neuroimaging performance category. MRI, magnetic resonance imaging; EEG, electroencephalography. EEG outcomes for a Serial Prediction task are not shown in the Forest Plot. The estimate [95% CI] for these tasks are: Visuomotor Task = 22.39 [17.76, 27.02], Perceptual Task = 2.79 [1.81, 3.77], Control Task = 15.04 [11.85, 18.23].

