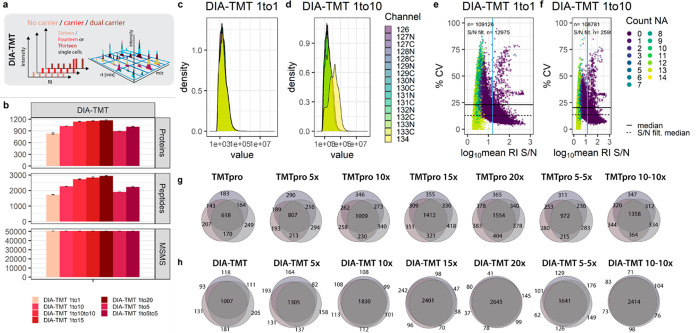
Figure 4.
Impact of intentional coisolation on “single-cell” variability and accuracy. (a) Graphical illustration of DIA-TMT acquisition strategies with carrier titrations. (b) Protein groups, peptide groups, and MS/MS scans of DIA-TMT samples at indicated carrier spikes. Median and mad are shown. (c and d) RI intensity distributions across all MS/MS scans and (e and f) %CV against log10 mean RI S/N for DIA-TMT samples at indicated carrier spikes. The horizontal solid and dashed lines indicate the median S/N across all MS/MS scans and post-S/N filtering, respectively. The vertical blue line indicates the S/N filter cutoff. Colors indicate the number of missing single-cell RIs. Replicate overlap of (g) DDA and the corresponding (h) DIA-TMT samples based on unique peptides.

