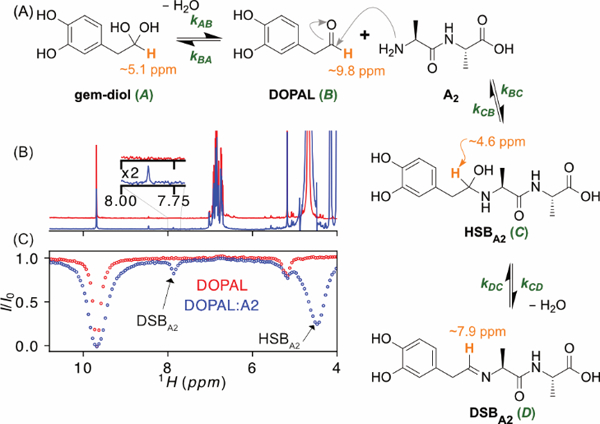
Figure 1.

Formation of DOPAL-dialanine Schiff base adduct. (A) Reaction scheme. The 1H used as a reporter for the four states is shown in orange. (B) Superimposed 1H NMR spectra of 2 mM DOPAL in the absence (red) and presence (blue) of 10 mM A2 measured at 600 MHz, in 10 mM sodium phosphate D2O buffer, pD 7.9, and T = 35 °C. (C) CEST attenuation profiles of the DOPAL aldehyde signal, obtained using B1 = 30 Hz, τcest = 5 s, on the samples with (blue) and without (red) A2, stepping the CEST frequency in 30 Hz increments from 4 to 11 ppm. Intensity dips assigned to the hydrated (carbinolamine) and dehydrated Schiff base positions are marked.
