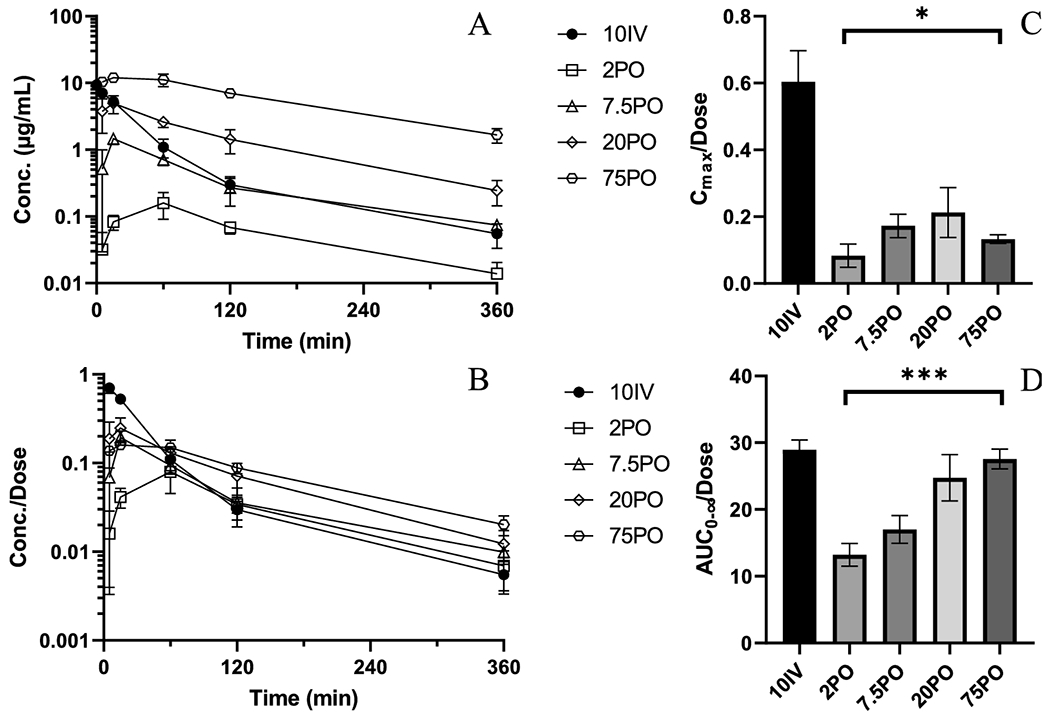
Figure 1.

PK and NCA of AZD6738 from bioavailability and dose linearity studies. A) Mean plasma concentration versus time profiles for 10IV (●), 2PO (○), 7.5PO (◇), 20PO (△), 75PO (□). B) Mean plasma concentrations normalized by administered dose versus time profiles C) Dose-normalized Cmax (ANOVA test of PO treated groups, p=0.0395) D) Dose-normalized AUC0-∞ (ANOVA test of PO treated groups, p=0.0002). Error bars represent ± SD for concentrations and ± SEM for AUC.
